Lets talk about the fact that we’d like that statement to be true, but that doesn’t necessarily make it true.
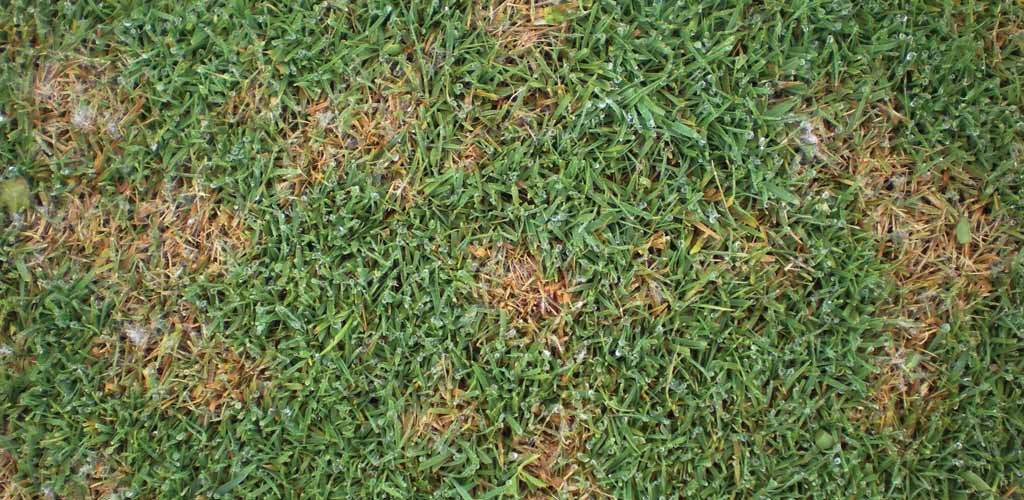
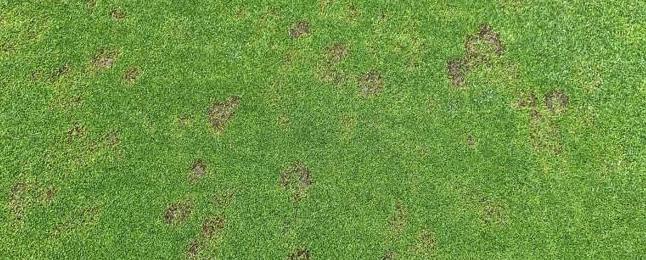
Its been a pretty tough disease season for Microdochium patch, if I were to guess I’d say:
- The majority got some level of disease cover in that wildly wet November
- The cold snap in December was a welcome relief in terms of disease pressure, but ended awkwardly mild which may have caught some on the back foot
- The outlook is dryer but once this cool spell finishes it looks to be mild and possibly sits us in disease territory again.
So whilst I’d love to say were all clean a clear, the reality is we may still have some challenge ahead of us this winter.
Glenn and I are doing a talk on summer diseases at BTME (spoiler alert for anyone sighed up to see it) and as part of that we touch on Microdochium. Not that we consider it a summer disease, whilst it can have a presence in summer, generally it is outpaced by growth if conditions are favourable.
But when preparing the presentation Glenn made a really nice graph to show the breakdown of temperature over a year. We’ve mentioned in previous blogs about the impact of leaf wetness on disease pressure but only touched lightly on temperatures and that’s the other major driver for fungal pathogens.
The graph shows the time spent at each temperature for the Midlands, its an average for the last ten years (we picked somewhere in the middle so its a little relevant to everyone (with microclimates you can’t pick anywhere representative for all, it may be vastly different even a short distance from this location)).
So essentially if you cut a whole year up into small red chunks (each representing 1 hour) then stacked said red chunks based on the temperature in that hour, you’d get this:
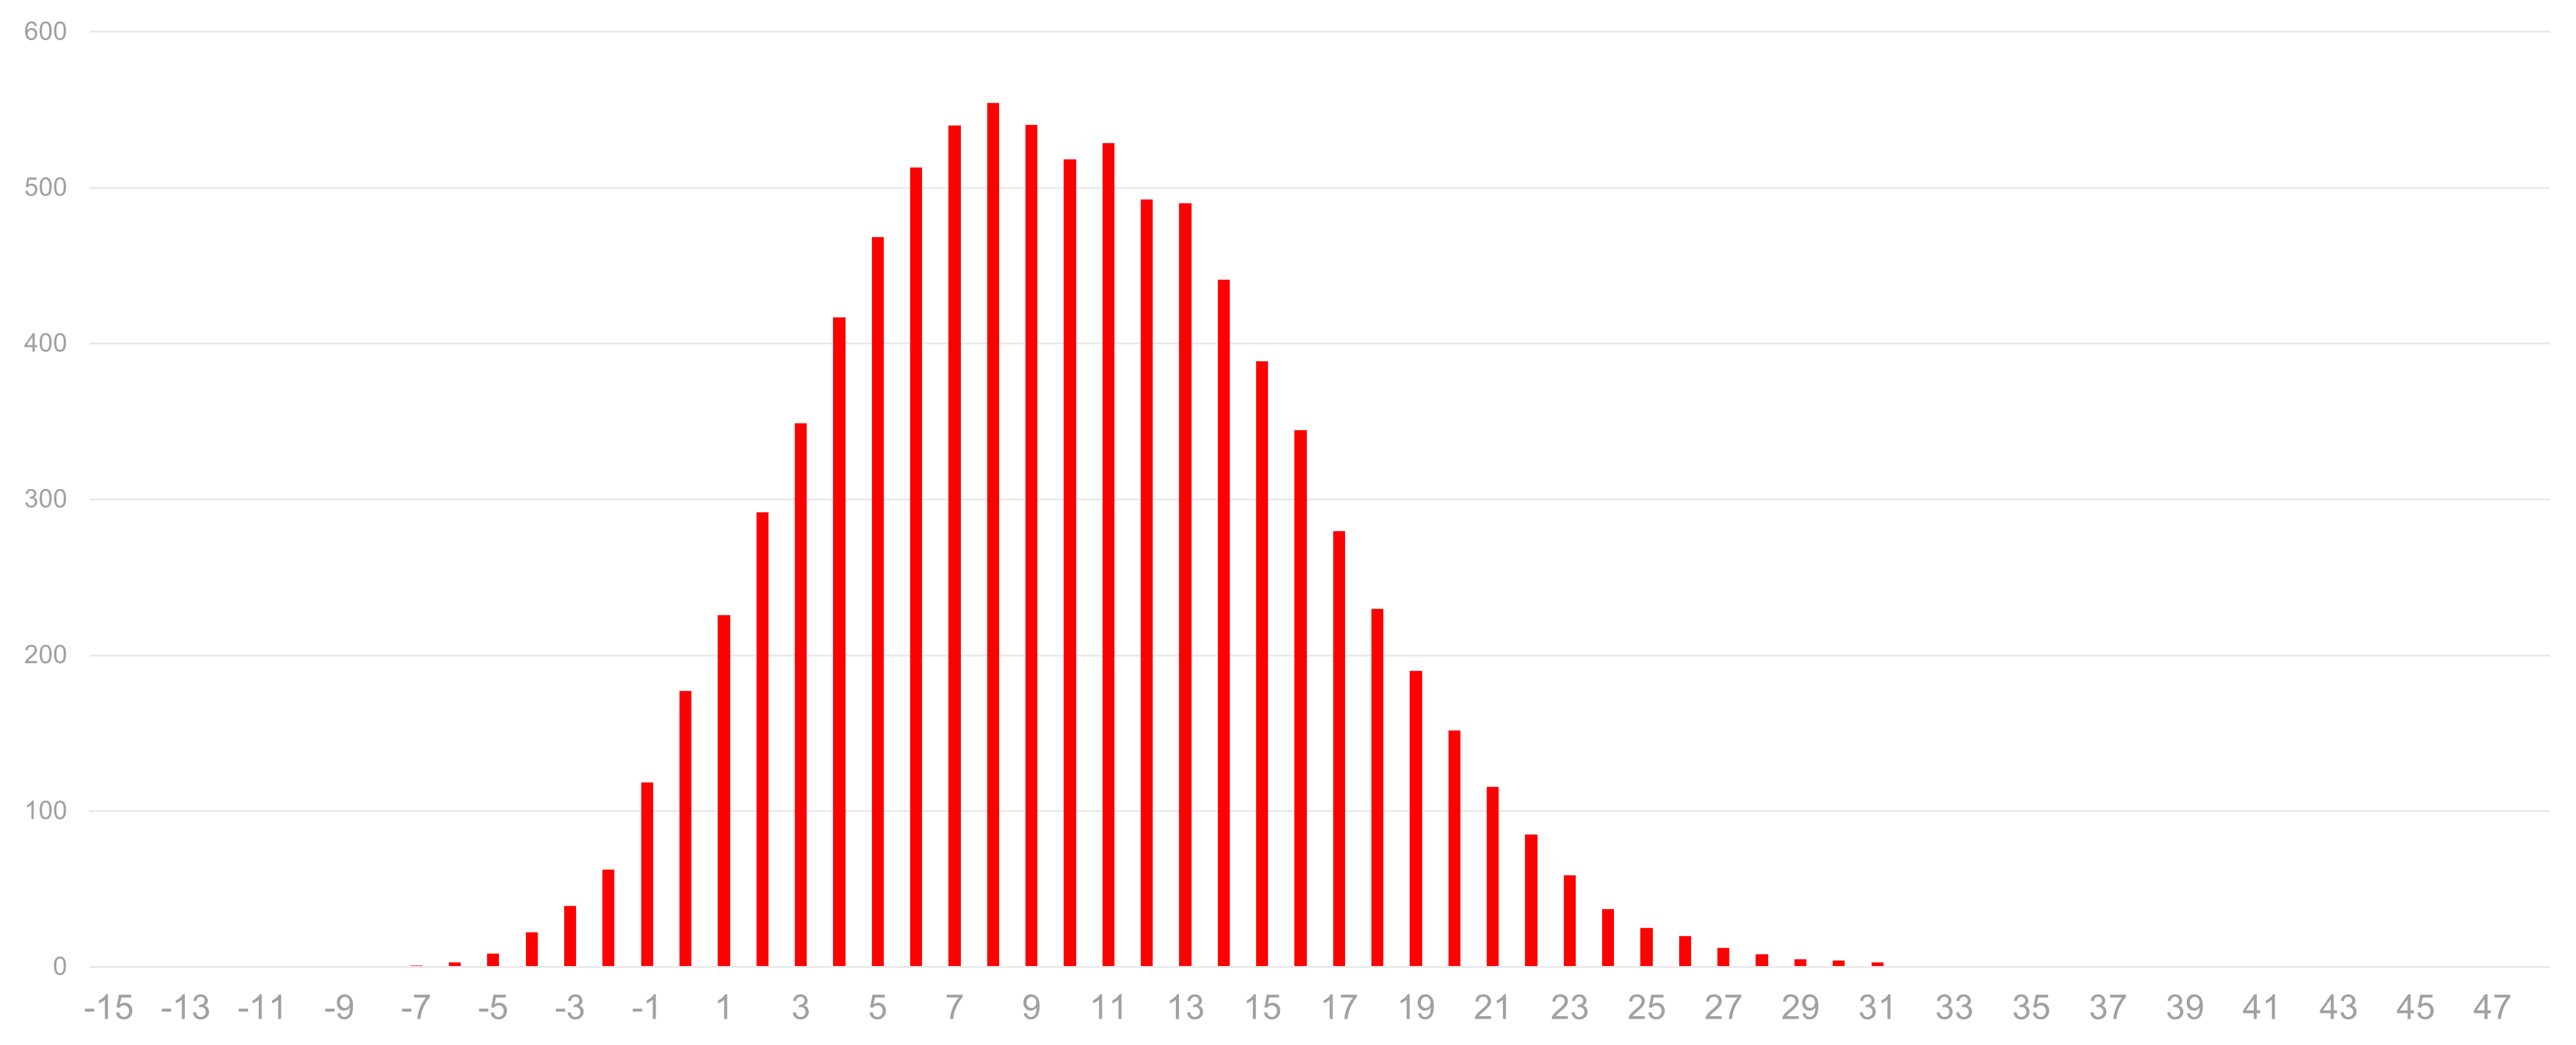
Its a pretty depressing picture, highlighting that we spend more time over a given year at 7, 8 and 9°C than at any other temperatures.
And whilst the media headlines focus on the sloping shoulders of the bell curve (the -5°C’s and +31°C) the reality is most of the time for us is spent in the middle.
The next picture helps show why we are so affected by Microdochium in the UK & Ireland, if we overlay the temperature it thrives at, it gets a little more depressing.
I’m calling this one “The Shadow of Microdochium”. Same 10 year average temperature graph of the Midlands but we see what a huge area falls under that Microdochium shadow.
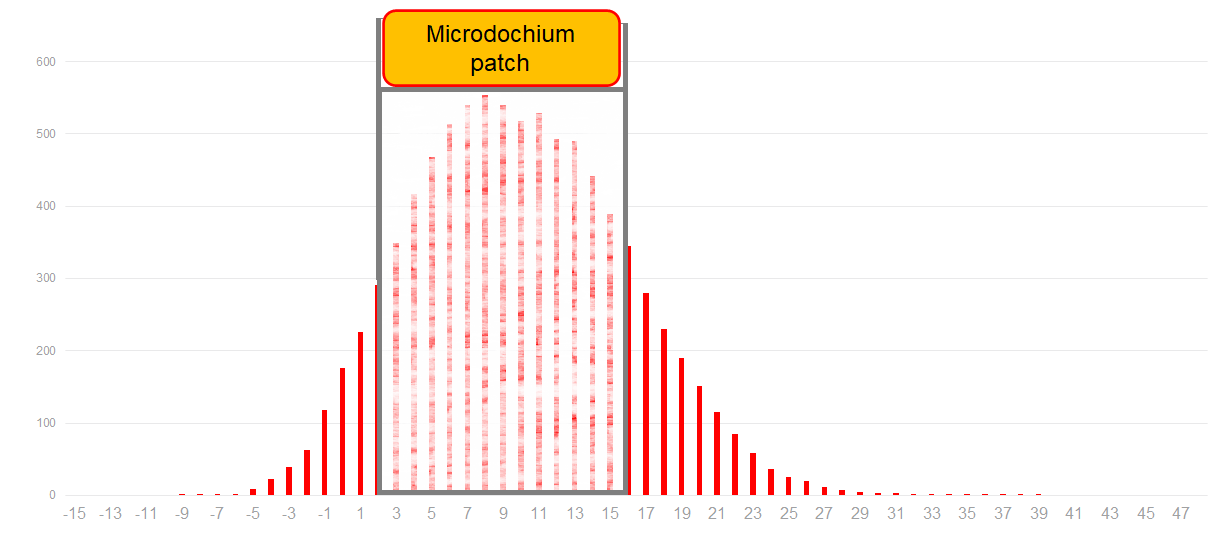
Its not all doom and gloom. Yes, it shows that in terms of temperature we are in sitting in the ‘happy place’ for Microdochium for much of the year, but:
- That’s not the only factor which gives disease, several of those nasty stars need to align (leaf wetness, sub optimal fertility etc.).
- Because its a big issue, and has been for a long time we have a broad knowledge base for dealing with it, and building programs to stay on top.
With BTME just around the corner its a great time to think about what you did this season, speak to others about it (always happy to chat on Syngenta stand B245) but also speak to peers in the industry and get their take when you reconnect.
Knowledge sharing is a really important part of the job.
Hopefully see everyone on the Early Bird run!