
I’ve done a few blogs on Dollar spot as it’s been a troublesome year. Lots of new reports coming in, and the worry its moving to previously untouched areas, of both the county and individual courses.
I’ve been watching it closely as I’ve had some Dollar spot trials going on, and we’ve been testing the new Turf Advisor app and its Smith-Kerns Dollar spot model behind the scenes also.
Have a look at this blog on the new app if you haven’t see it already.
![]()
The apps been really helpful for monitoring Dollar spot pressure from the phone, it’s super easy to check whenever the mood strikes you.
The final results are in for one of the Dollar spot trials we did this year, thanks to Liam Rowlands of ICL for doing the lions share of the assessments over the year!
We wanted to know two things:
- Can we get control of these aggressive Dollar spot strains?
- Can Turf Advisor help us time these applications?
This is the last in a series of blogs on Dollar spot this year, to catch up on the previous one click here.
I won’t do a full recap of what’s been said before, but we essentially selected the Tees with historical disease pressure (20 of them), half of each was sprayed when required, and the other half was not sprayed with fungicides all season.
All other maintenance practices remained the same between the two halves.
I wanted to trial on Tees instead of greens because if disease had severely broken out on greens during the trial we’d have been under pressure to treat the untreated areas also, and so loose the trial.
What’s good for this study: relentless Dollar spot pressure, is not so good for presenting a putting surface.
Results
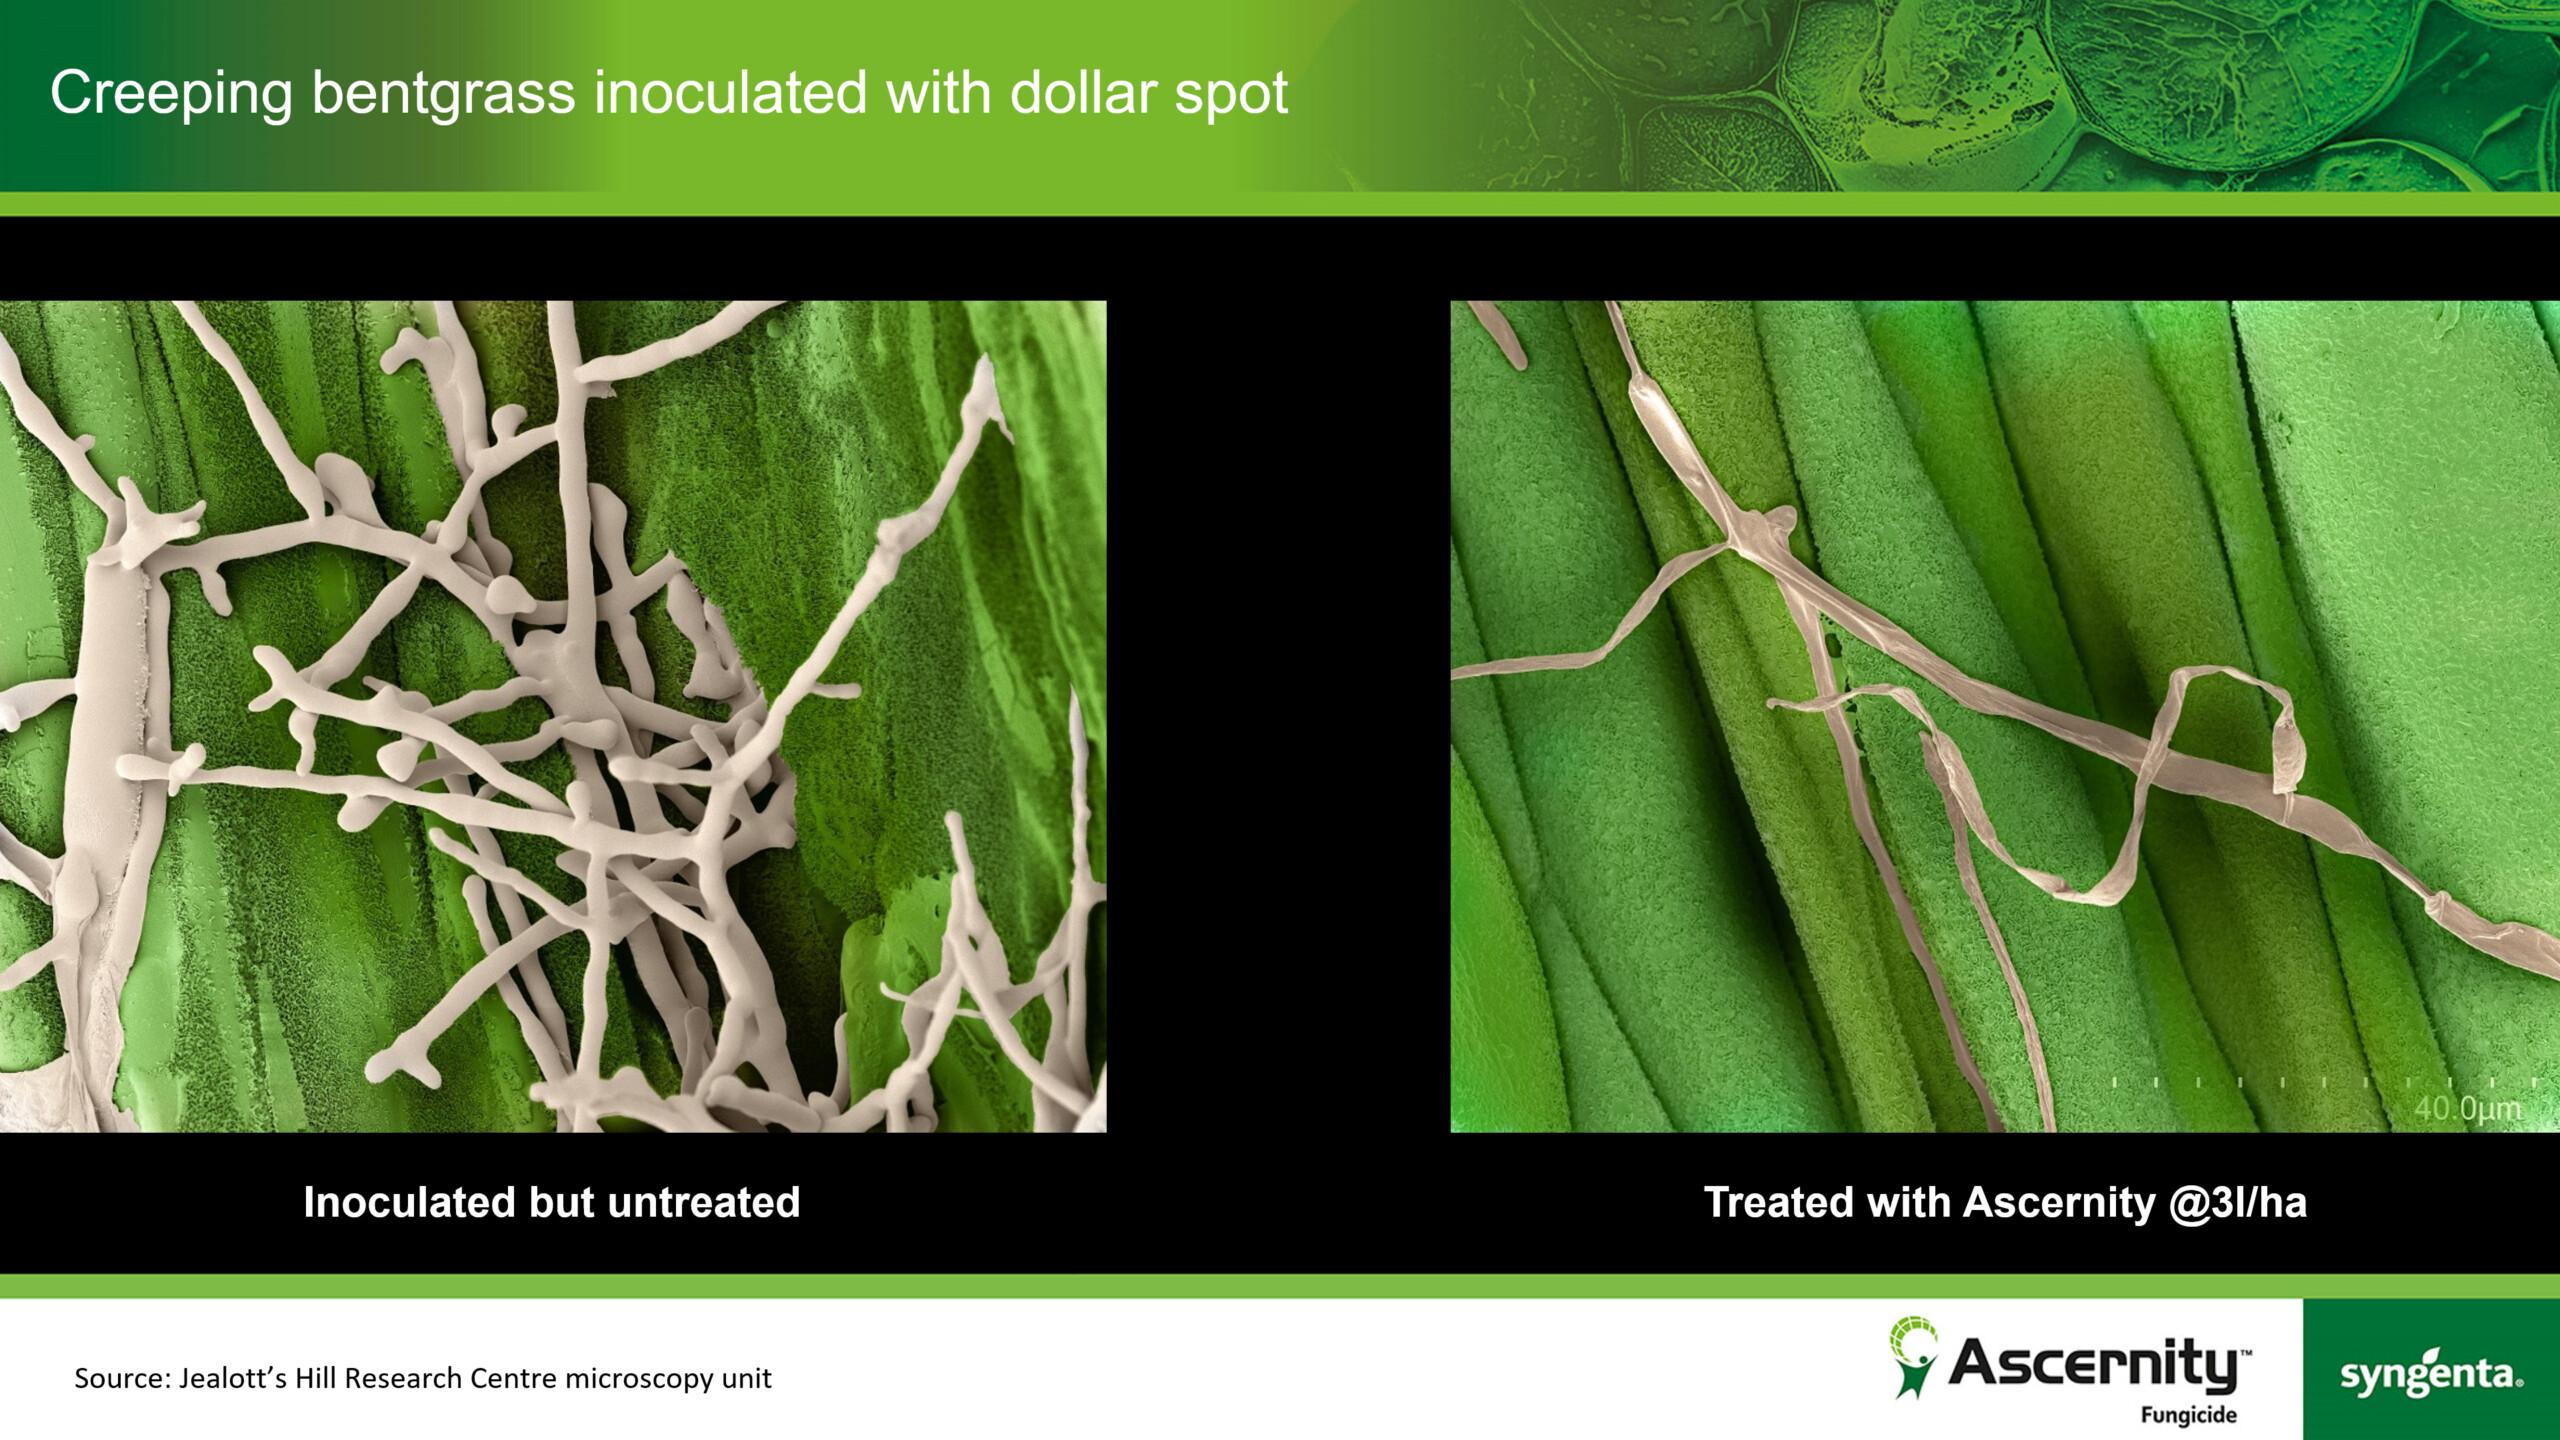
The quadrat part of the trial.
White square was dropped on the same spot on each side of each Tee, weekly assessments, and % Dollar spot disease cover assessed.
The graph also shows the timings of the applications, the first two being registered products and the others pre-registration currently (but we’re working on it).
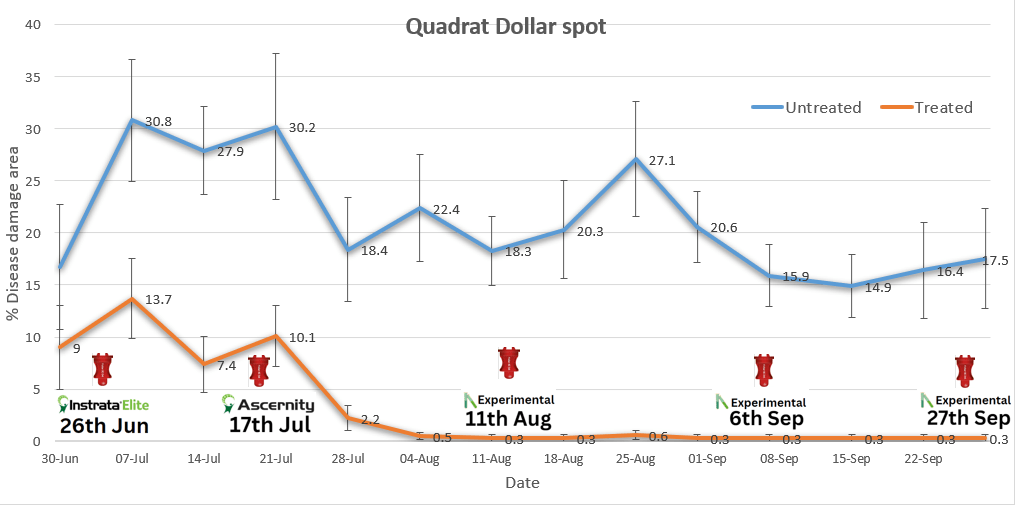
The blue line is the untreated side which gives 15 – 30% turf cover lost to Dollar spot.
We started the trial in late June which you can see was a very challenging period for disease pressure.
First disease out brakes were spotted in May so I’d suggest if your looking to follow Smith-Kerns driven application timings next year I’d start monitoring pressure at the start of May.
Looking back I wish I’d got my ducks in a row sooner and started the trial before the first out brake, to keep disease low all season.
In the graph below we are looking at Smith-Kerns % Dollar spot pressure for the trial site.
The data was taken from the back end of Turf Advisor.
The Red line is 2023 pressure, above 20% is considered higher risk of disease.
It’s a strange graph to look at, were calling it “The Cave”.
The bottom black bar (floor of he cave) is the lowest pressure has been since 2012, and the top of the cave (black bar) is the highest.
Much like when caving, we want our red line to keep its head down as it walks through the cave, the lower towards the floor the better!
But it tells us that there are times we are pretty safe from Dollar spot (December – Start of May), and for the rest of the time we should be watching out for it.
You can also see that in 2023 at this site pressure was consistently above 20% from Mid July to October.
What you need to do for your site is:
- Monitor the pressure
- Map that against disease out brakes
20% is the figure given in the model, but Turf advisor allows you to set your own threshold.
Why is that important?
Depending on sward composition (some grass varieties are less or more susceptible to Dollar spot), management practices and microclimates on site, the % number where you see an outbreak will be different!
Some sites will see disease at 11% and others not until 30% it’s about figuring out the number for you and tracking that.
Once you have that you can use it as an application threshold if you want to get control of Dollar spot.
Dollar spot looks to be getting worst in the UK & Ireland as the climate shifts, so we will continue to look at this and there is lots more to learn!
Thank you to all those involved in the Dollar spot trials this year, the support is much appreciated.
I’ll leave you with a short video on the Smith-Kerns model as an overview from Syngenta USA, some interesting takeaways but also different to us on timings etc.
Chris Gitsham
Please send me your news letters.
2023-11-15 10:10:20
Sean Loakes
Hi Chris, You can sign up to get the blog emails at the bottom of the blog page, in the green bar.You can sign up for the Syngenta turf newsletter also: https://www.syngentaturf.co.uk/user/registerThanks Sean
2023-11-20 11:07:48