July is the first full month of Summer, which can bring some powerful growth and recovery if conditions hold, but also the threat of Dollar spot.
It’s know as a Summer disease as it doesn’t like cooler temperatures so much. As we talked about in a previous blog on Dollar spot it needs that warmth and moisture to develop. But from the data on when disease pressure is highest you wouldn’t be wrong to call it a Summer and Autumn disease.
You can see in the graph below that historically speaking (and this is the last 13 years data for Central Southern England) that July sees the highest number of days over 20% dollar spot pressure fairly consistently.
2022 we can see that light blue line is actually higher in November, with over 10 days logged above 20% pressure last year!
It has the potential to give us a very long Dollar spot season.
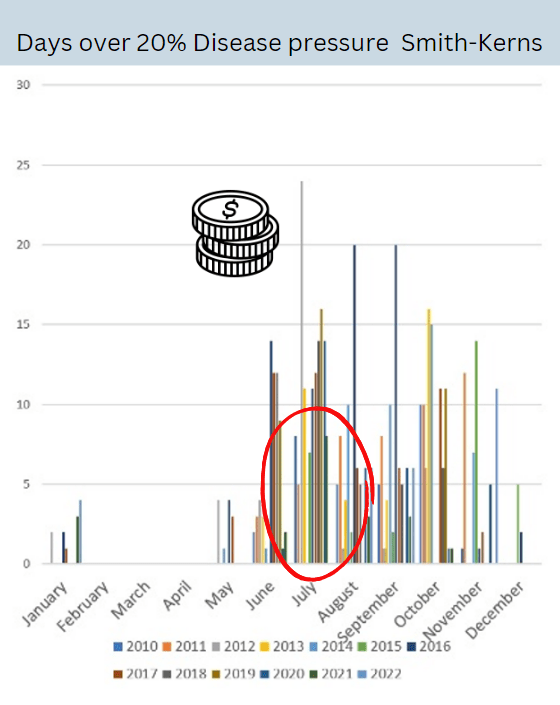
20% is generally considered the threshold where you’ll start to see Dollar spot kick on.
As with all models its not perfect, if turf stress levels are low, cultural practices are on point and you’ve got some nice disease resistant cultivars in that sward then you probably wouldn’t see disease at that pressure.
Equally if nutrition is very low or the irrigation set up is delivering to much, or at the wrong times then then you may see disease under 20% pressure.
The issue we’ve got with climate change is were seeing it push the UK into higher dollar spot pressure more of the time. See the BBC article on climate change here.
That’s got two effects, if the trend continues;
- Courses who already have Dollar spot problems can expect to see more damage, or damage to new areas.
- Courses who’ve not had issues before may start to see it (shuffling Northward)
It’s not the headline figures of “42°C hits Britain” that’s the issue for Dollar spot (excess heat is an issue for many other reasons!).
Dollar spot is not active above 35°C, so really its the creep of those minimum temperatures up, which is almost unnoticeable and certainly not making headlines, which will be driving the increase in Dollar spot problems.
Below is not the perfect way to view dollar spot pressure, as an average over a few weeks, as it may be very high pressure over a few days in that period that gives you disease headaches, and the rest of the time the pressure drops down low, making the average not that stand out a figure.
But it is an easy way to see high pressure periods.
The thick black line shows us the 13 year average for dollar spot for given blocks of weeks. From that it looks like we don’t really need to worry about dollar spot other than in August.
The issue is that the 13 year average masks the fact that the last few years have produced much higher disease pressure.

The user trials we’ve got on Dollar spot this year are all up and running and I’ve got the first bits of data to share soon.
We want to try and understand the factors which lead to Dollar spot problems in the UK. So I’ve been keeping a close eye on the Smith-Kerns model for my area of South Wales along with the trial sites.
Thinking of Dollar spot as a Summer disease made me watch out for high temperature spikes like the one below. Thinking that would show me a disease pressure spike also:
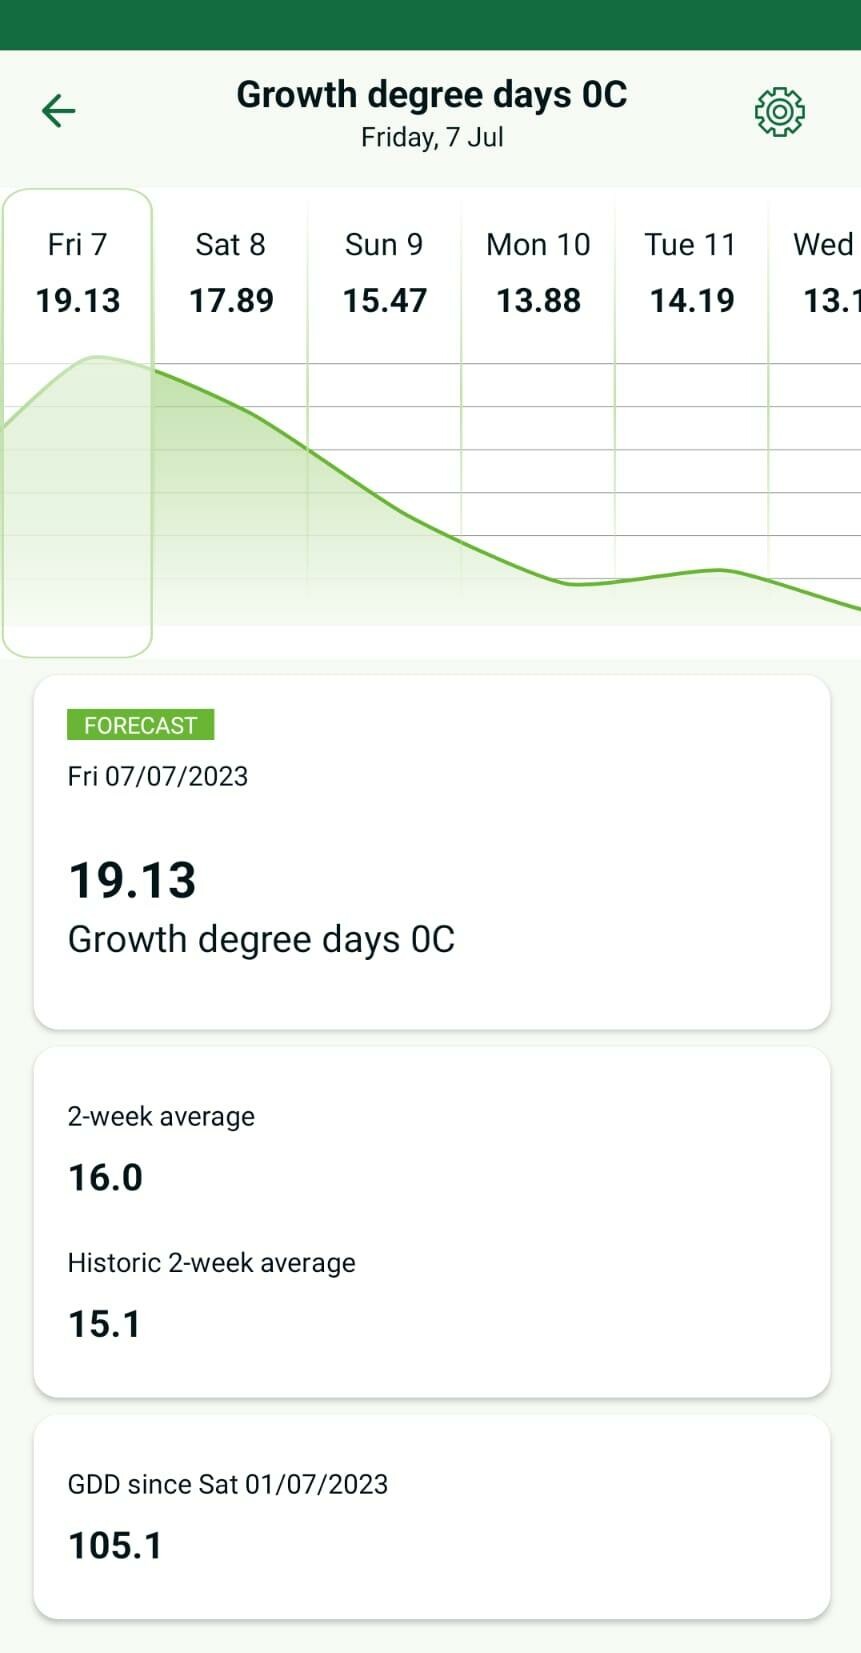
With almost 20 GDD a day I expected to see an equal spike in pressure for the Friday and Saturday. But not much later in the week where it cools off a bit.
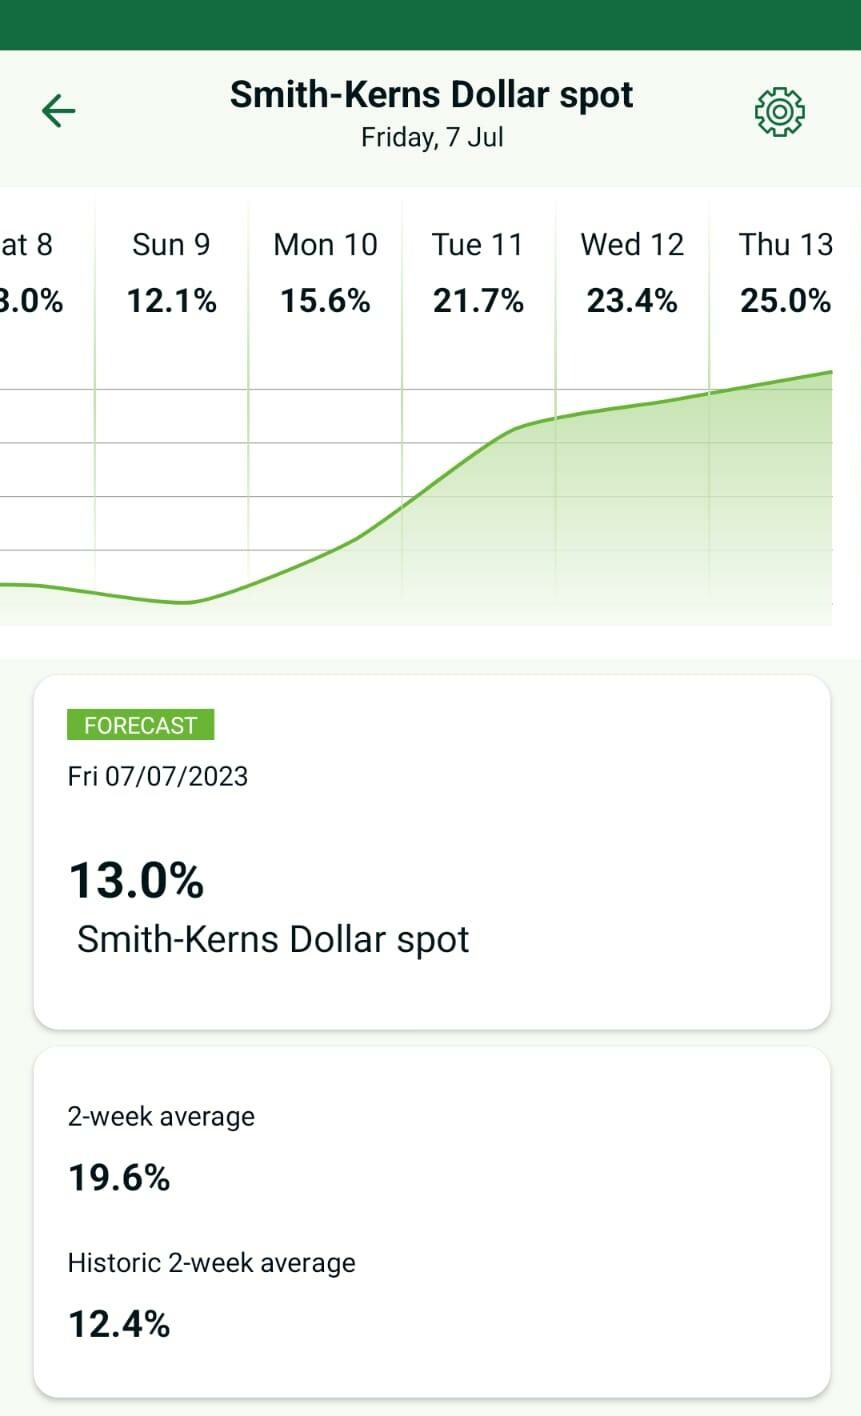
But you can’t see a spike until later in the week. So I looked at rainfall and that gave the answer, in combination with the warm temperatures.
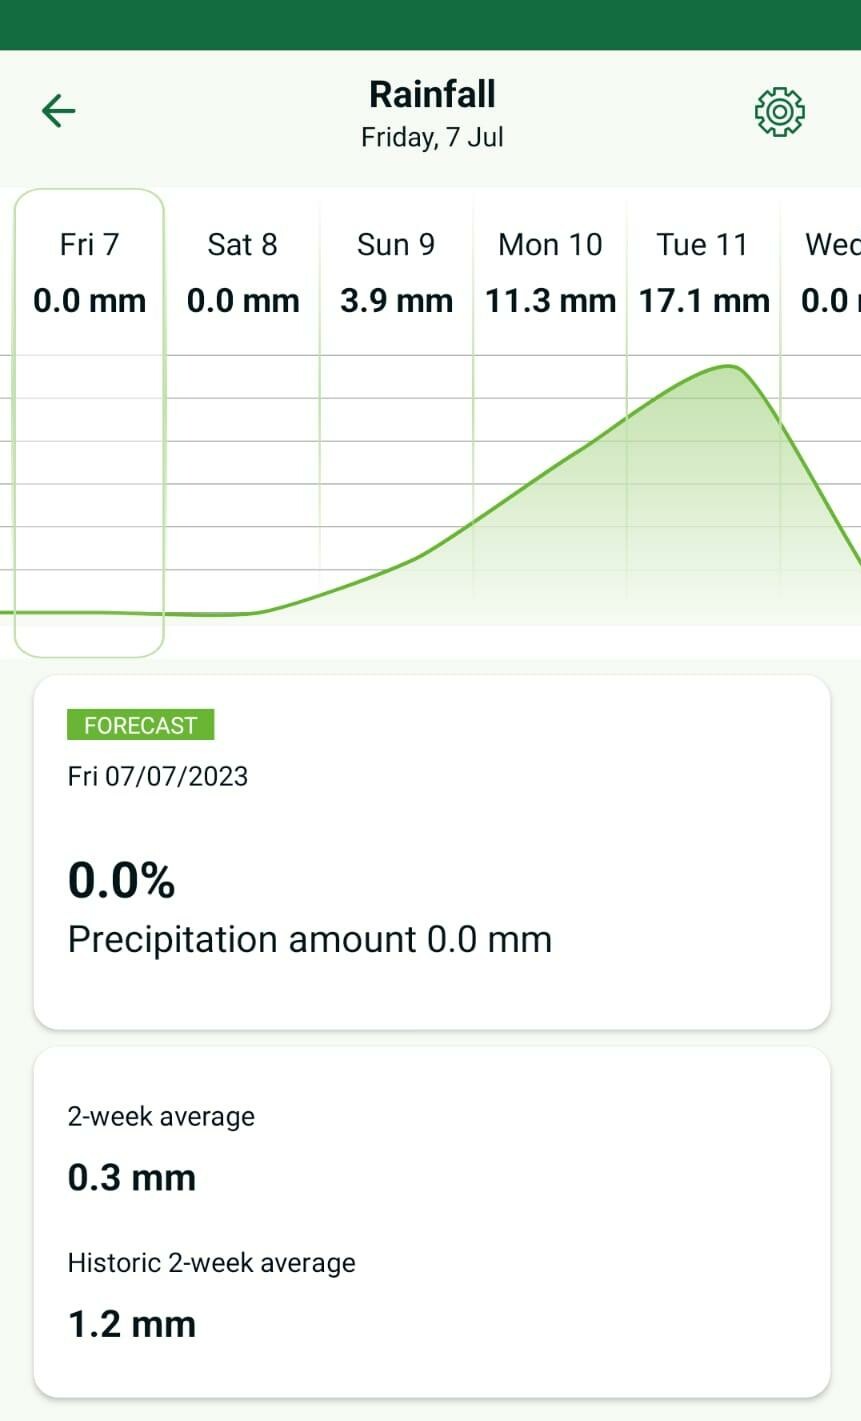
A big rain event is going to lead to levels of heightened humidity in the turf canopy as it evaporates away.
Digital tools like the Syngenta weather app in BETA testing currently will make it much easier to monitor Dollar spot disease pressure, but it’s also important to understand what’s driving the increased pressure.
What we can learn from this example is that a heavy rain event drove up the pressure above 20% meaning we’re more likely to see Dollar spot outbreaks.
But the model won’t capture water you are putting out your self to manage any drought conditions so be mindful that excess irrigation could lead to higher disease pressure.


Glen Deegan
Excellent information, I got alot out of it. Thanks
2023-07-08 14:35:10