
I did a presentation this week for the BIGGA Continue 2 Learn programme which you can find at the bottom of this. You can listen to this blog as a Podcast if that is easier for you. Just tap play below.
I intend to expand on a few of the points I made in that presentation in a little more detail later on.
Tom Wood of Agrovista Amenity came back to me with a great set of questions which I think I should try and pick up on ASAP as the data we can gather right now will help us shape the programmes of next year.
What are the thresholds Glenn?
What numbers should we aim at?
How many leatherJackets can we tolerate?
I’ve mentioned thresholds a few times and tried to avoid putting a specific number on it as I really couldn’t get a handle on what to aim at.
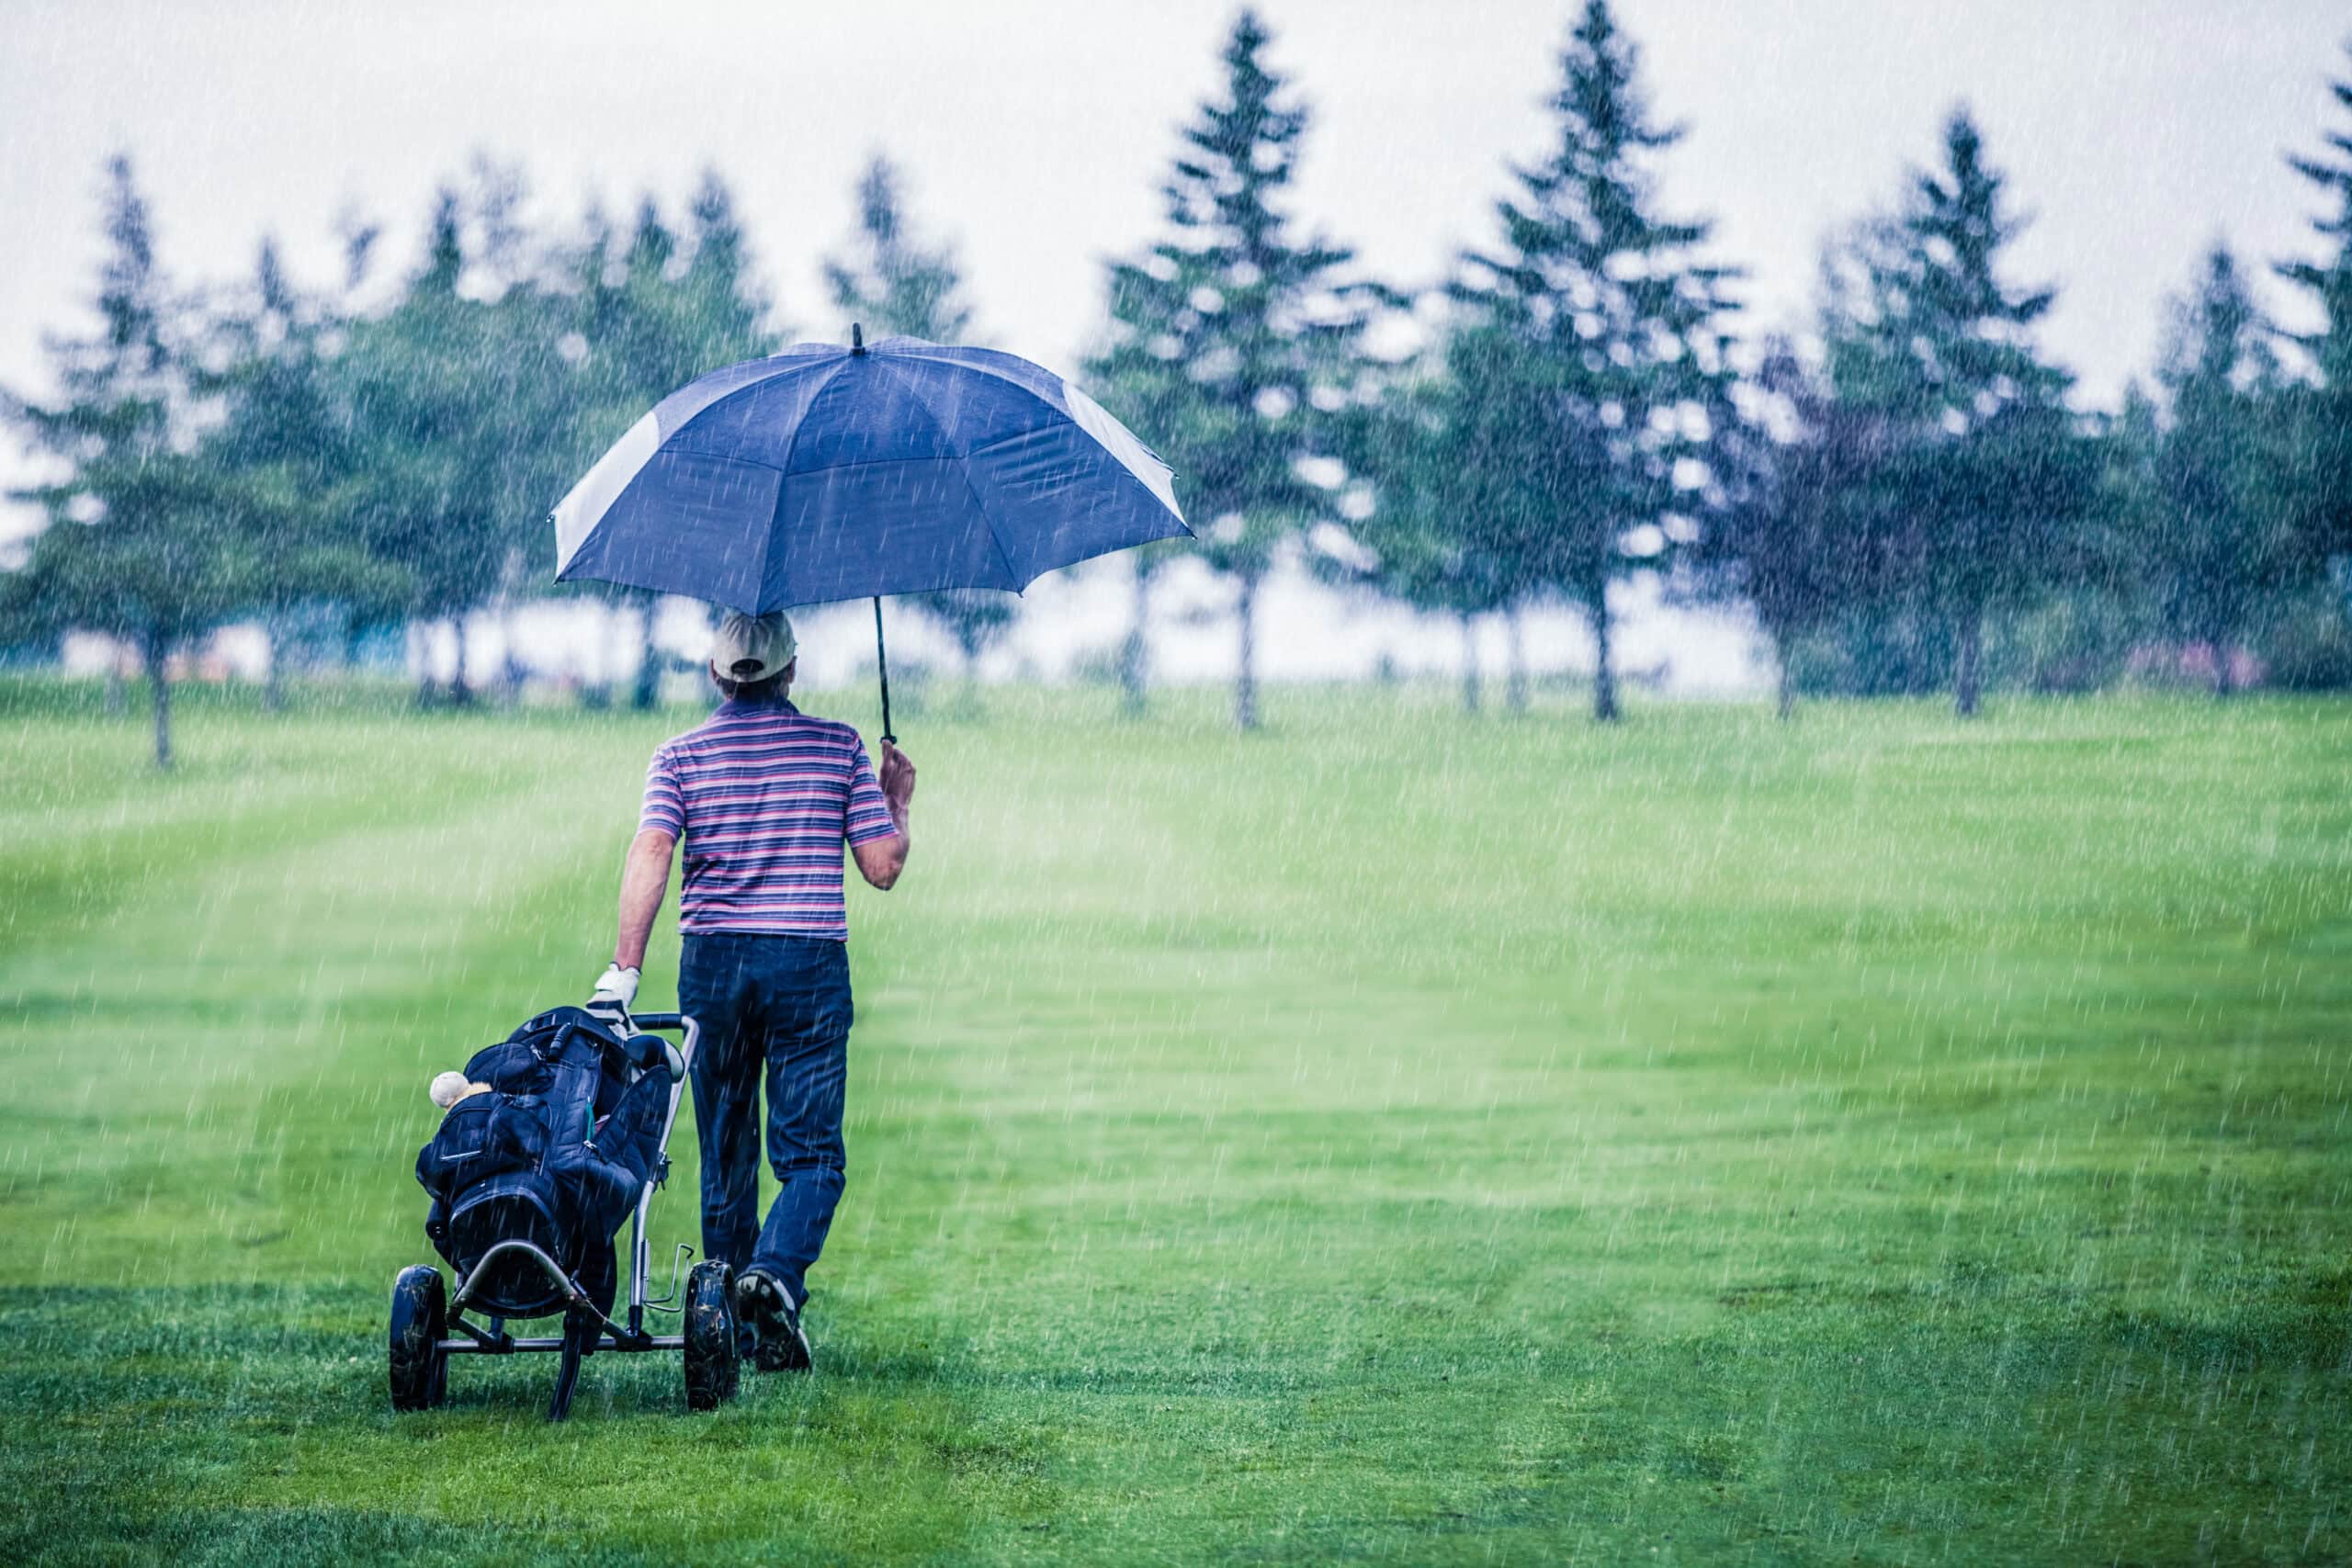
After all – is it that important? A cold site with slow growing fescue would tolerate a lower level than a ryegrass sward in good temperatures? If we could comfortably handle 300 leatherjackets per square meter and still provide great putting surfaces would we worry? I suspect not, we probably be pretty pleased that we are playing host to another insect – but they are not turf friendly and they do damage.
Let’s not forget that we are here to present great putting surfaces not to wage war on a specific species of insect!
I am a little worried we are now trying to reduce the numbers to 0 rather than gauge how many we can tolerate. 0 populations I suspect have never been and never will be possible.
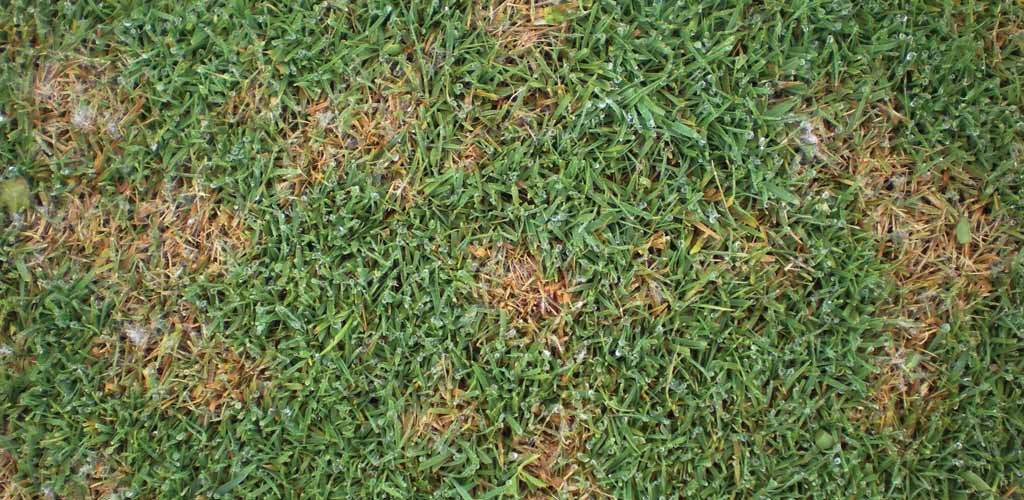
So from this point of view surely we should be measuring damage not LeatherJacket populations?
So how do we measure damage?
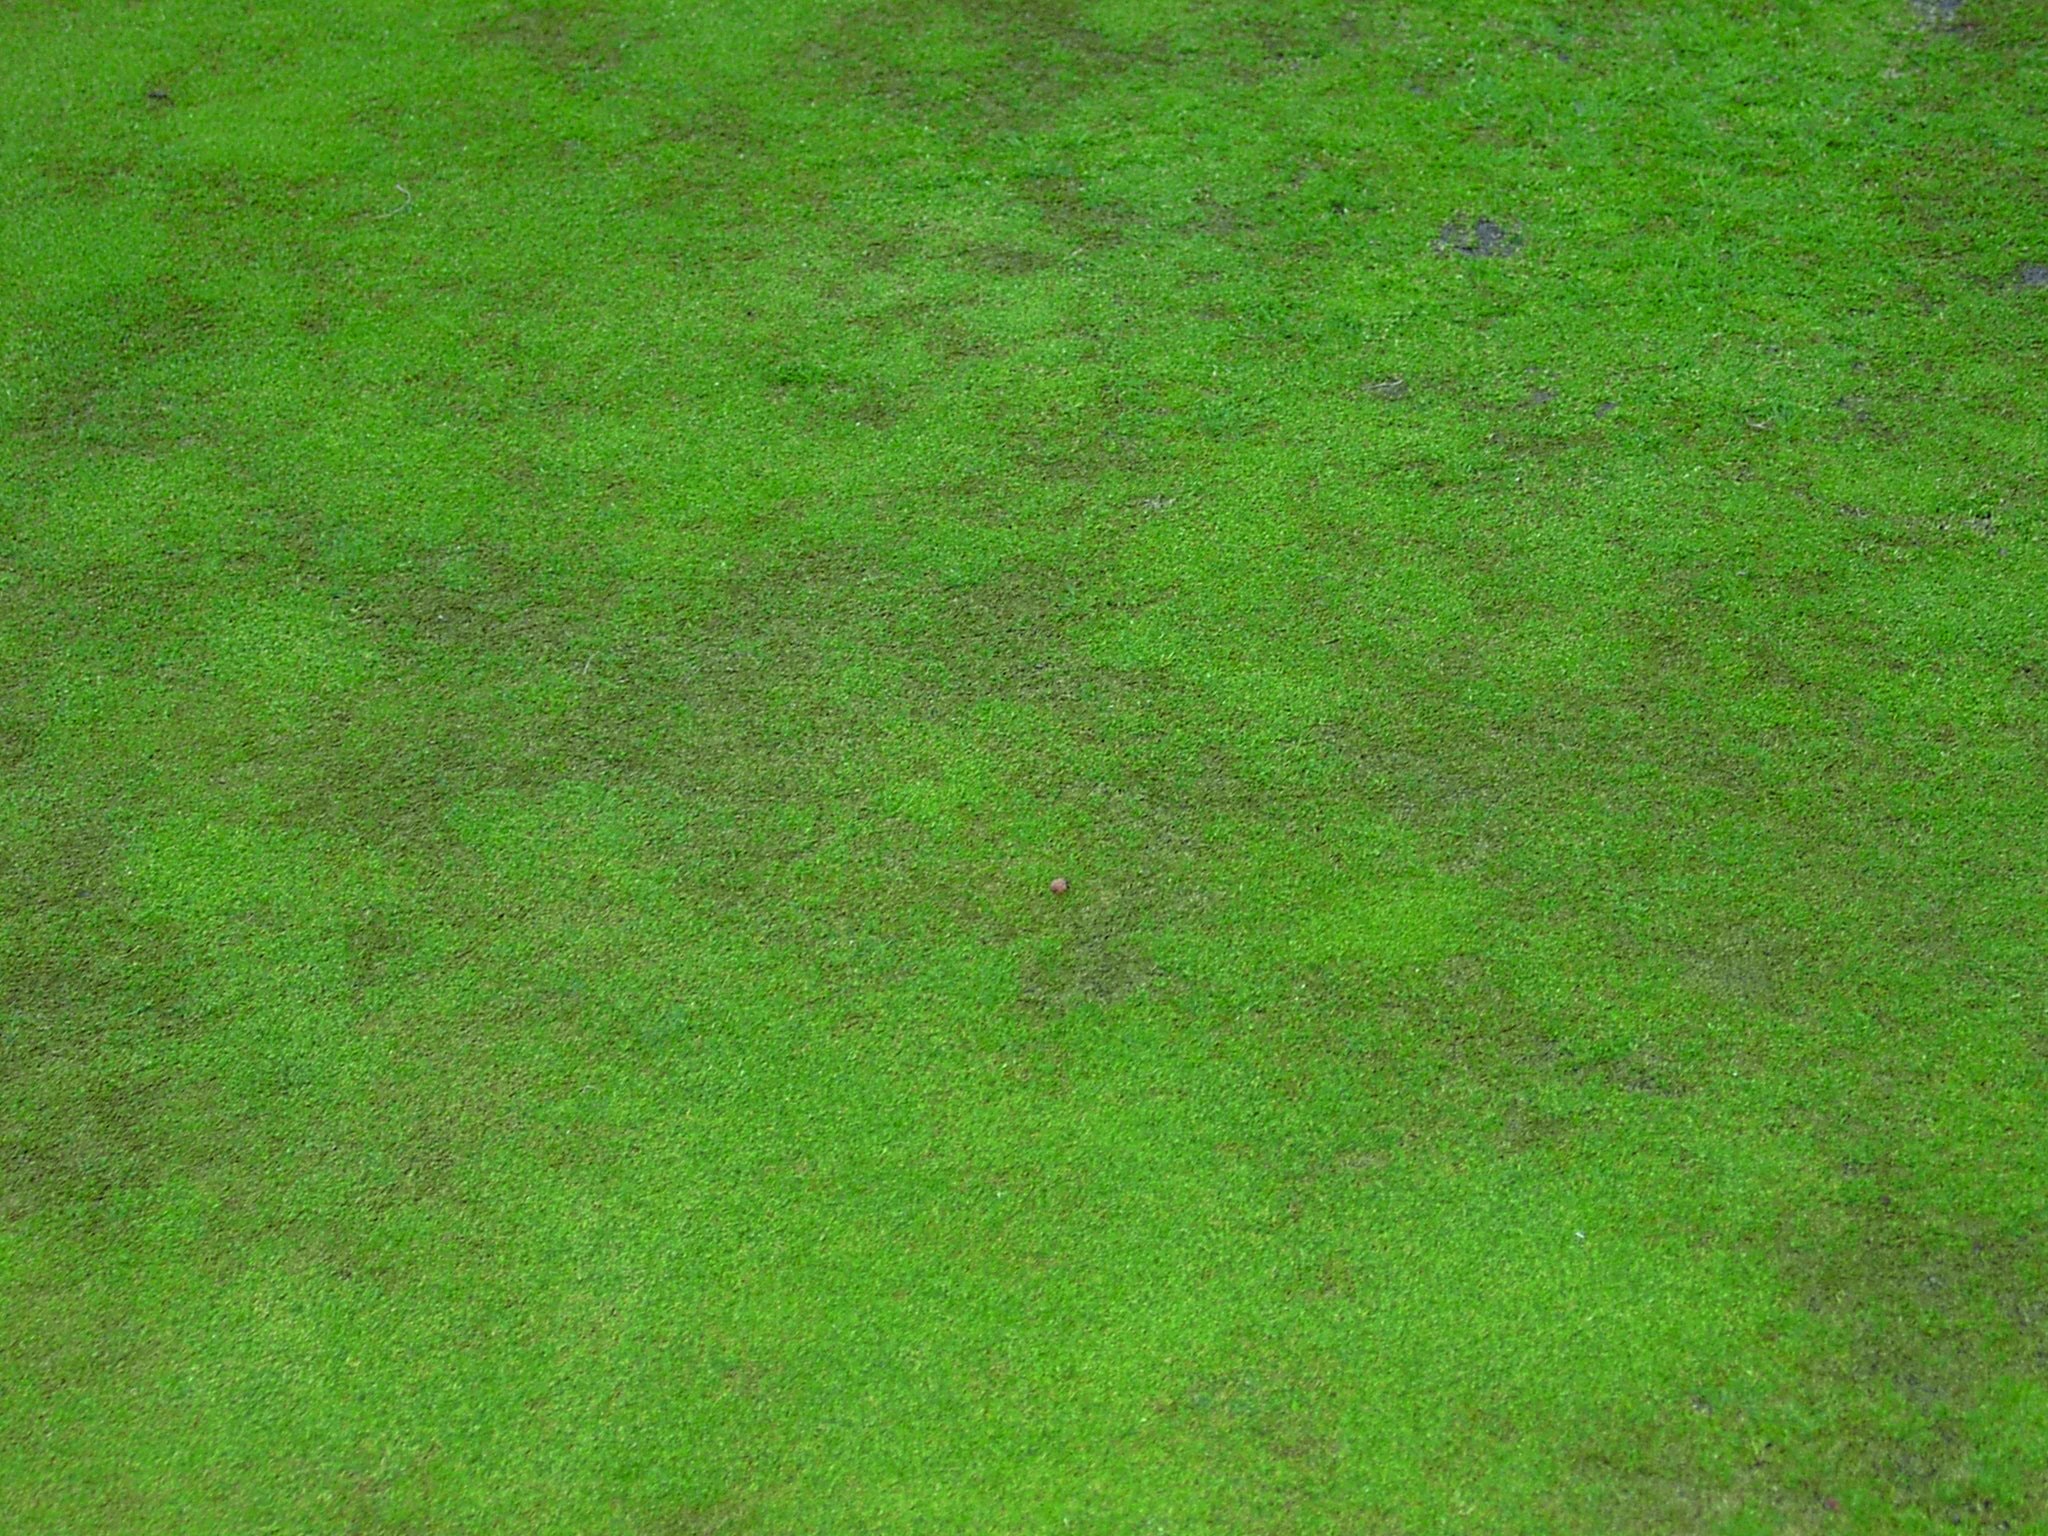
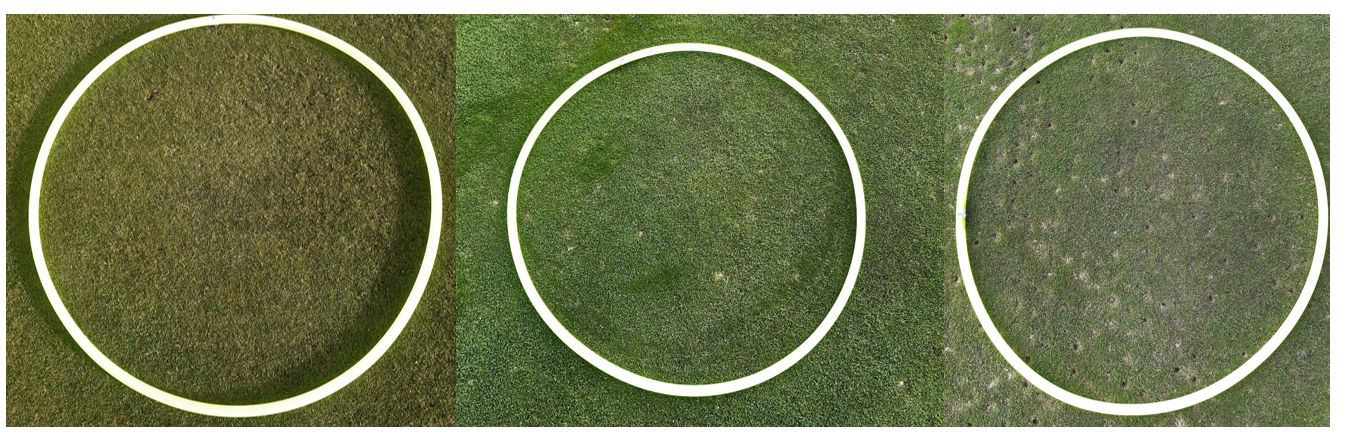
The way I do it is to take my trusty hula hoop and randomly throw it around on greens – 10 times works pretty well but the more you do the more accurate the figure. Every time the hula hoop lands you count inside the hoop all the damage that can be attributed to Leatherjackets. It takes a bit of getting your eye in but you can quickly establish what is LeatherJacket damage. I think this a great job for a willing volunteer – it’s actually better to get someone outside the team to do it as it becomes a more independent figure.
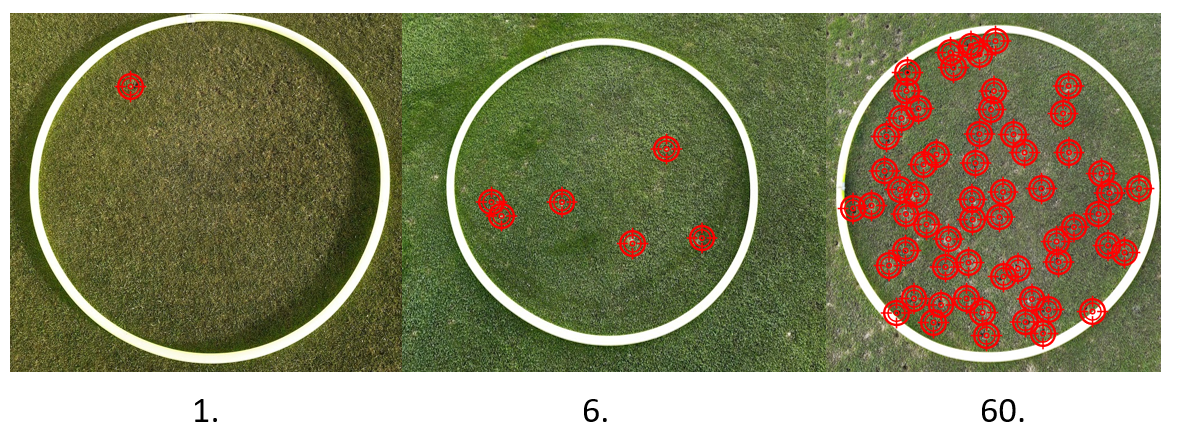
My hula hoop is 0.46m2 in area (How to work out area of circle link here…) so if we counted 50 pieces of leatherjacket associated damage in 10 hula hoops (4.6m2) that would equate to 10.9 damage/m2. Which is as close as we can get to an unequivocal measurement.
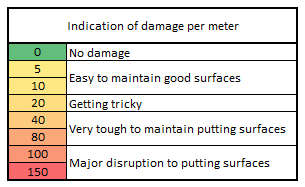
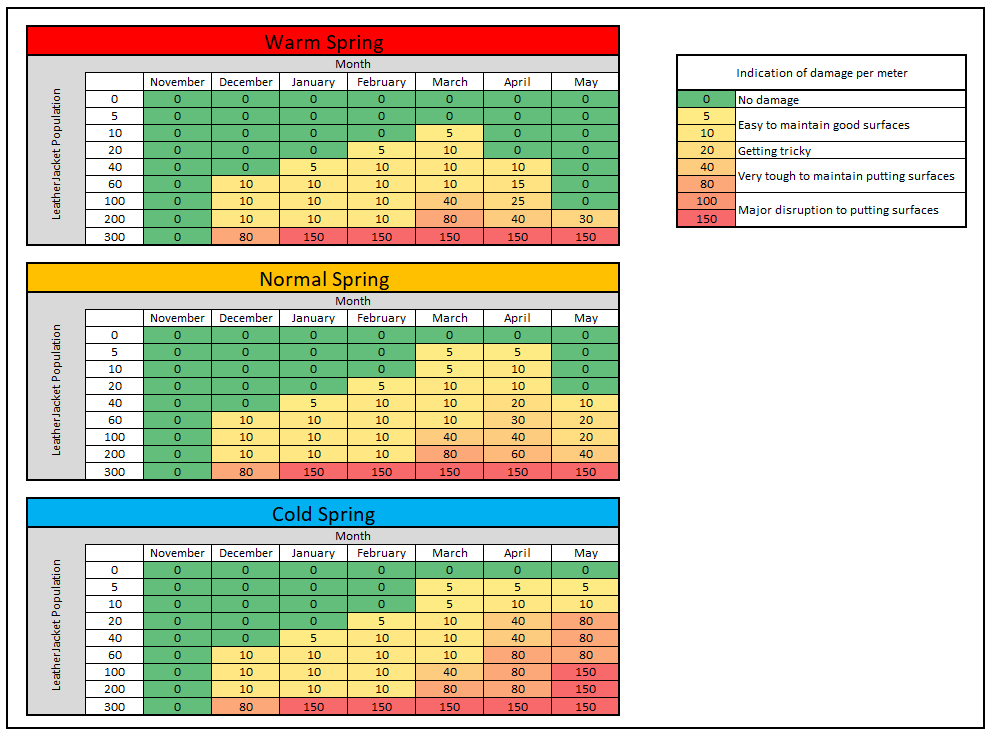
I’ve done a few of these now and the above table is my initial stab at what the damage thresholds mean. Of course these will evolve with time. They are likely to be different at different sites and clubs.
It’s a pretty quick task to undertake and generally takes me about 2 hours to walk a course and assess all 18 greens. At least 10 minutes of that is spent listening to golfers make various hula hoop jokes which are about as funny as the lay the turf green side up ones!
If your still not sure theres a video below of two fellas who are probably balder than they realise judging from this dodgy camera angle!
The counting can be pretty tough when you get to higher numbers but as long as you’re consistent with your method it’s fine.
Population counts
Population counts are also important, they are easy enough to do. Take a one square meter tarpaulin and peg it down on your green overnight whilst temperatures are above 4C. Then count the numbers of leatherjackets underneath. Again a great job for a keen member to put out for you and you do the counting in the morning. I got some 1m square sheets with eyelets made up here….. for not too much money.
How will this help?
Once we have these two figures we can start associating the two. After all the population isn’t representative of the level of damage we will see, that is related to the amount of growth and feeding habits rather than the number. If we have 50 Leatherjackets per meter we may well be able to have great greens in a warm spring but really struggle in a cold Spring? If we grab the data now whilst we are in the depth of this problem we can build a picture of thresholds for next year.
After all if we monitor in Early December and we’re seeing 20 per m2 what are we expecting in the Spring?
So to answer Toms original questions (thanks Tom!) my first attempt at this is in the below tables. There are 3 tables for different Springs to highlight the challenges of different growing conditions.
Using this method we could well give ourselves a better chance to deal with this problem early, prepare ourselves and communicate with golf clubs and begin to predict the scale of work we need to put in.