At last I’ve free’d a bit of time up to have a dive into 3 years worth of PestTracker data, and your efforts are continuing to deliver some insights into cranefly trends in the UK and Ireland.
After looking through it all we’re continuing to see how it will play an important role in managing leatherjackets as well as helping us continue to achieve future Emergency Authorisations.
If you’re a regular reader of this blog you’ll be familiar with the below graph showing when Craneflys are spotted across the UK.
Insight 1.
All 3 years have shown pretty similar patterns with the peak of flight coming around week 38 or mid to end of September.
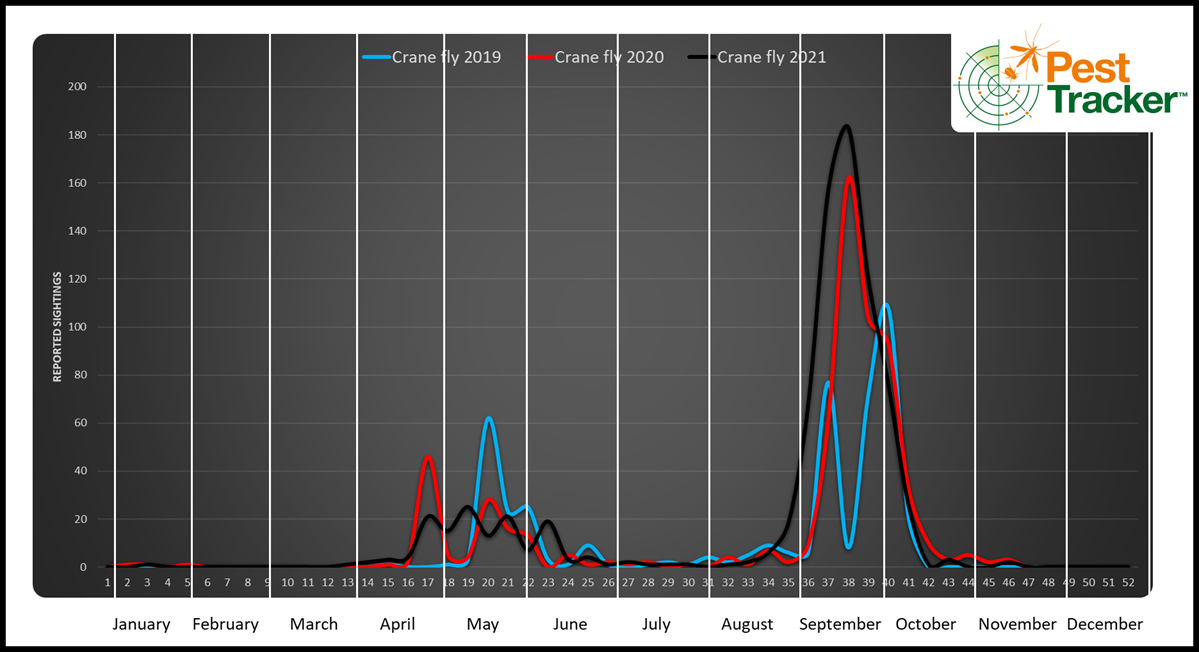
There is an increase in reported sightings year on year of sightings I suspect reflects the growing interest and/or concern that surrounds this challenge rather than and increase in actual numbers of cranefly.
Insight 2. North to South
I’ve long suspected that the Cranefly hatch is earlier the further North you are. It’s tricky to tell with the noise of all the reports coming in during the same period of time.
The different numbers of reports caused by greater concentration of golf courses in some areas of the country really blurs the picture when you’re looking at it all as one big lump.
Having made time to split all the regions out based on postcode I’ve managed to split out the top third of the country from the lower third and break it down to a percentage of reports so the report curves are the same scale.
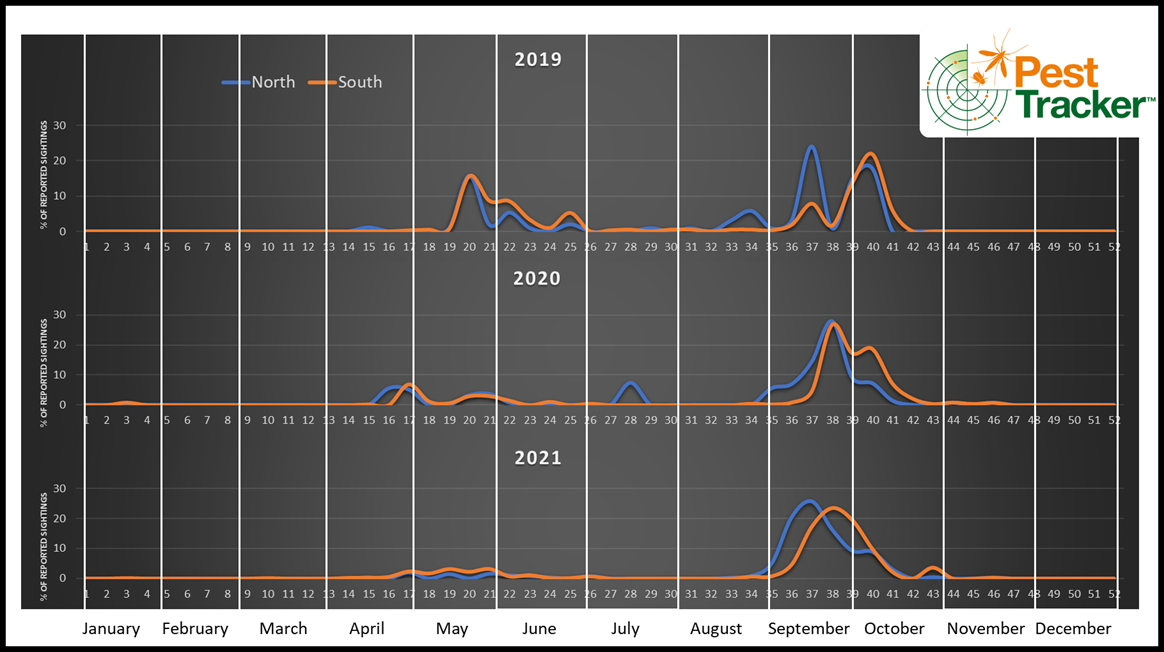
What we can then begin to see is the Spring hatch shows no real difference but the Autumn hatch patterns do differ. By omitting the middle of the country we can begin to see the two patterns and now we have three years of data it begins to give us the confidence that this is a pattern rather than an unusual year.
This gives me confidence to say the hatch tends to start earlier in the North and it extends longer in the South. Leading to more bespoke application advice for the future.
Insight 3. Growth Degree days or Feeding Degree days?
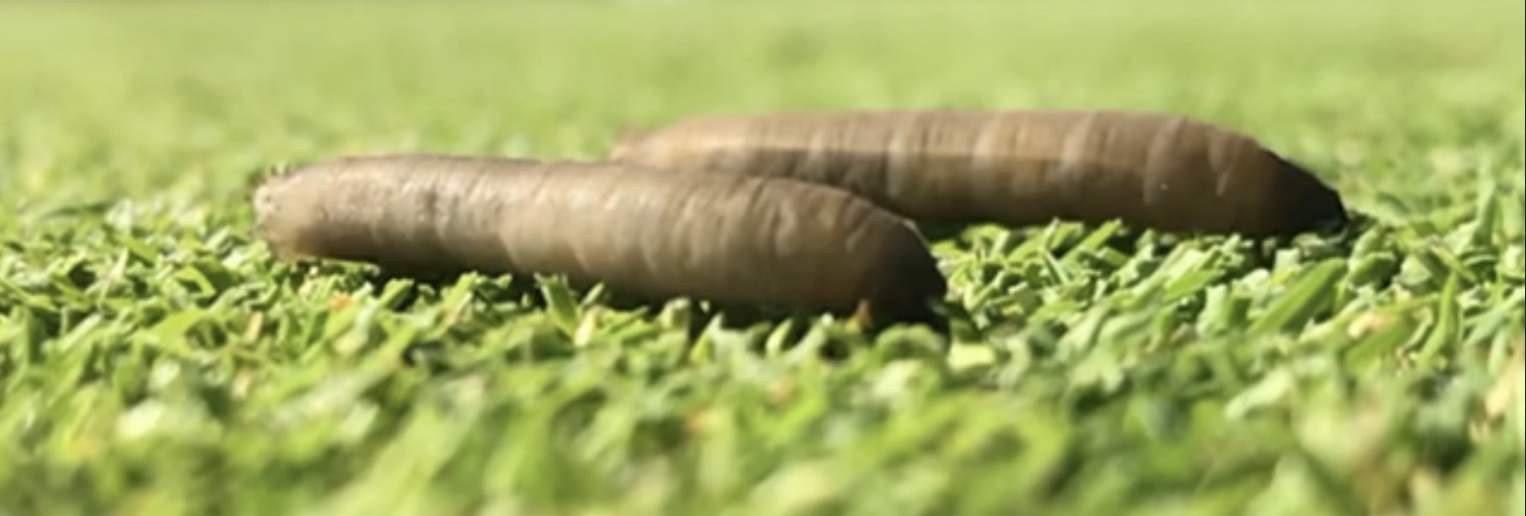
Last year if you saw me speaking about LeatherJackets and our user trials you would have heard me talking about the potential of using a GDD model to help us understand the insects larvaes development. Leatherjacket activity is related to temperature and the longer they are in an ideal temperature range the longer they have to feed and develop (Blog here….).
GDD models potentially enable us to monitor the development opportunity an insect has and whilst we are at an early stage in understanding this I am now able to use PestTracker reports along with weather conditions for a site and coupled with application dates really start to understand the successes and faliures.
This is all based on having reports though – the more you log sightings for your area, the better chance we have of understanding how things are interacting. The more data the better – so next year – if you log 10 times, we have a better chance of understanding what’s happened than if you just log once.
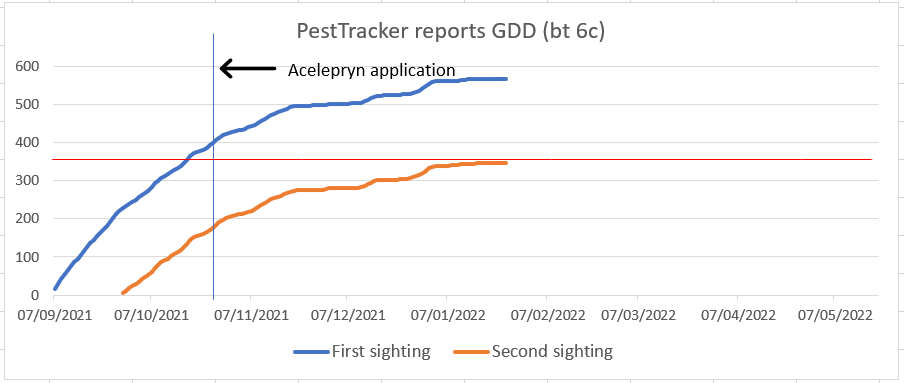
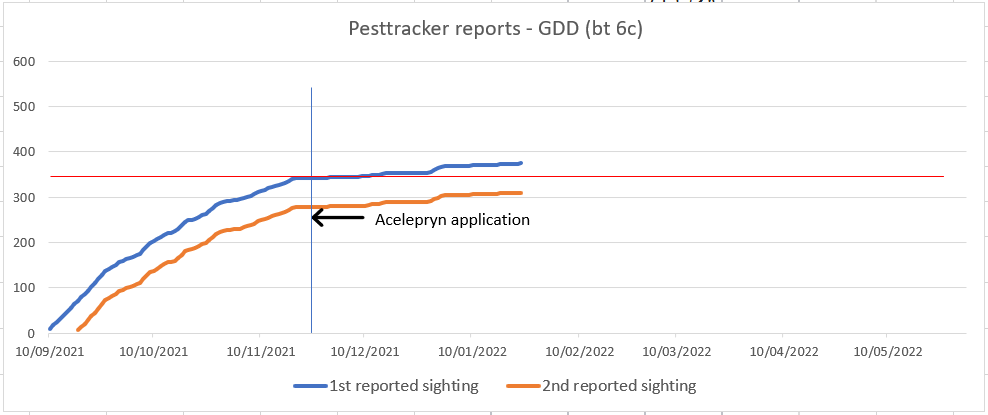
These graphs show us:
- When we are likely to see damage (history shows us a figure of around 350GDD is when we begin to see feeding outstrip growth).
- Whether Acelepryn applications had time to impact the maturing larvae before they stopped feeding
- How steep the development curve of the LeatherJacket has been
- The difference in development patterns between the first and last of the Leatherjackets were laid.
It’s a long way from perfect but I thought it was worth sharing since you’re the ones submitting the data – Thank you.
Read the January 2022 – Frequently Asked Questions (asked by you) here.