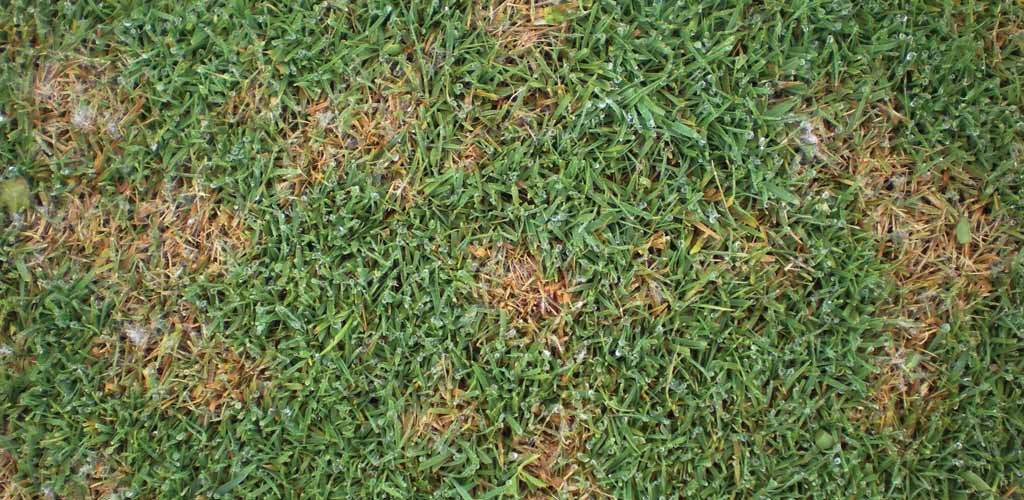
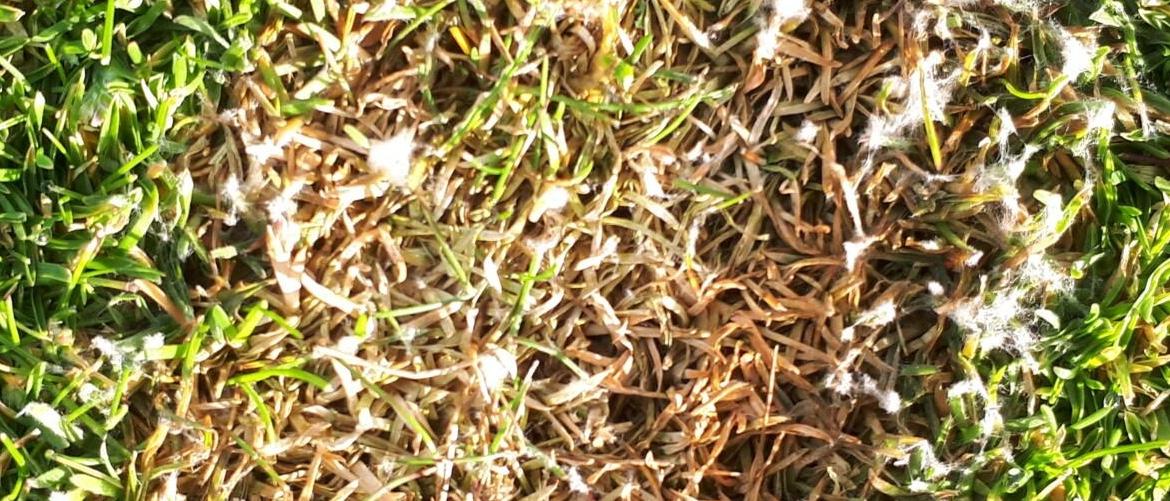
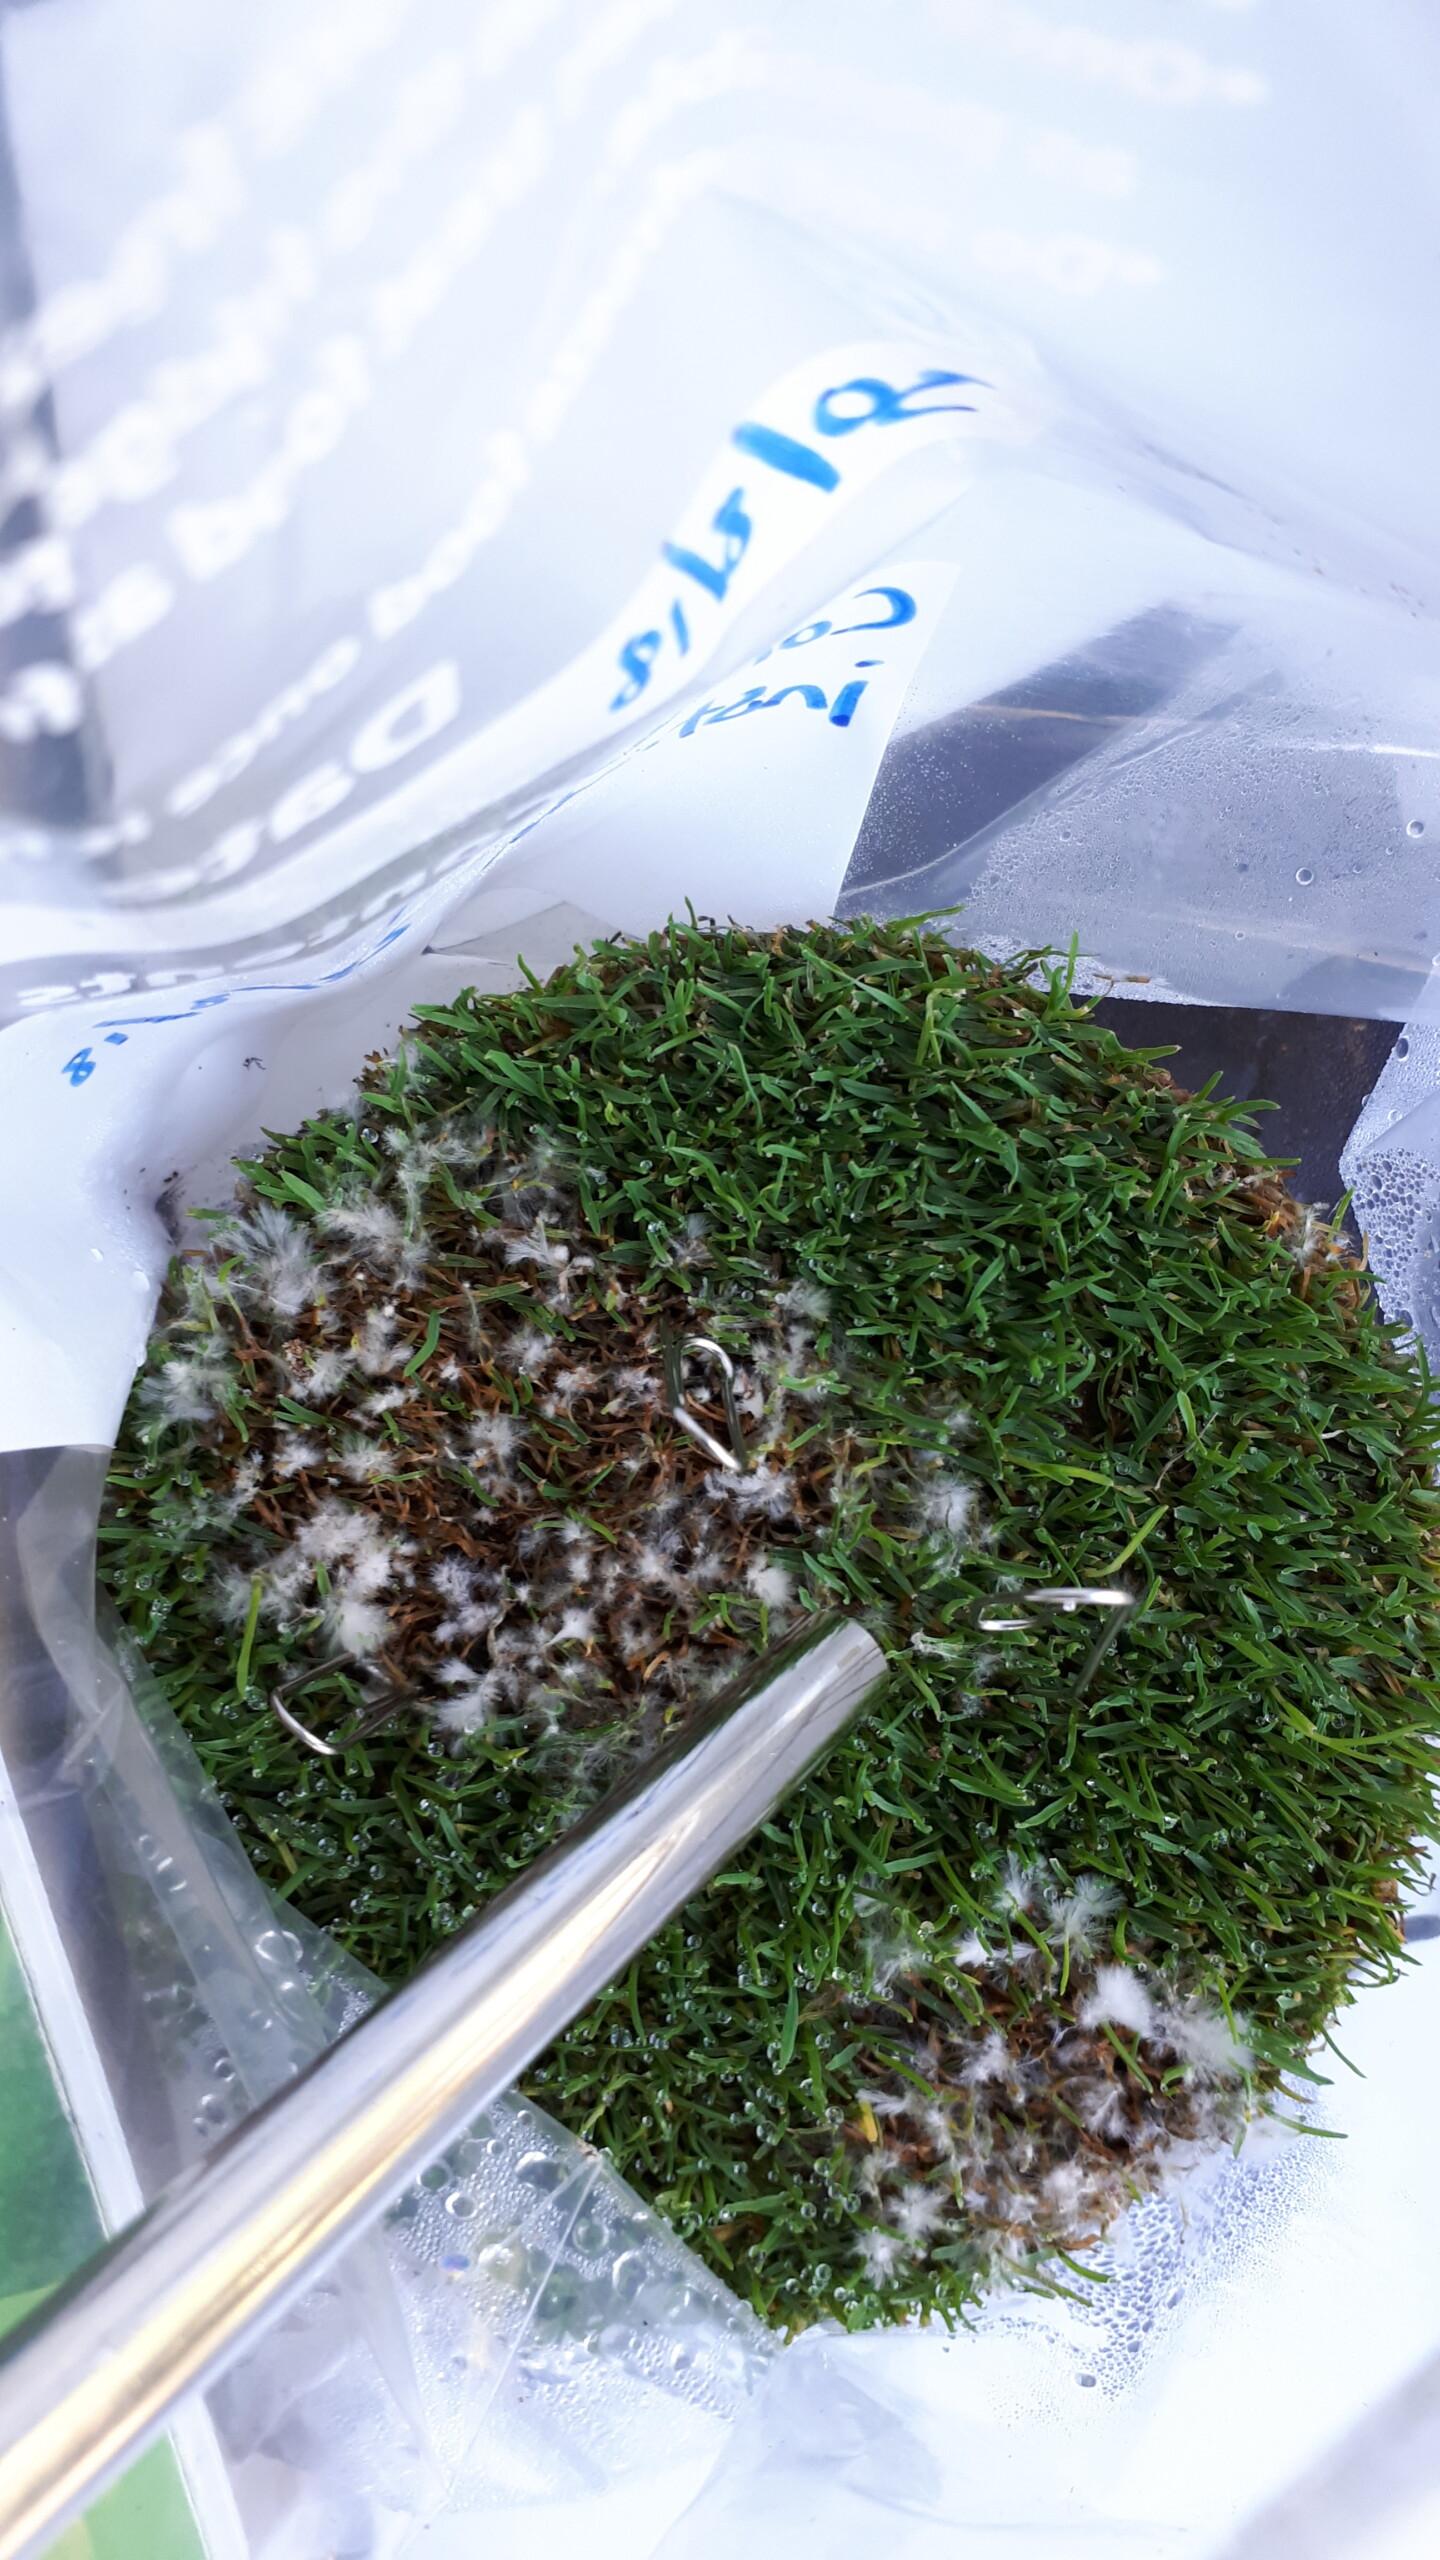
Microdochium patch disease (the artist formerly known as Fusarium) is one of the biggest threats to turf playing surfaces in our area.
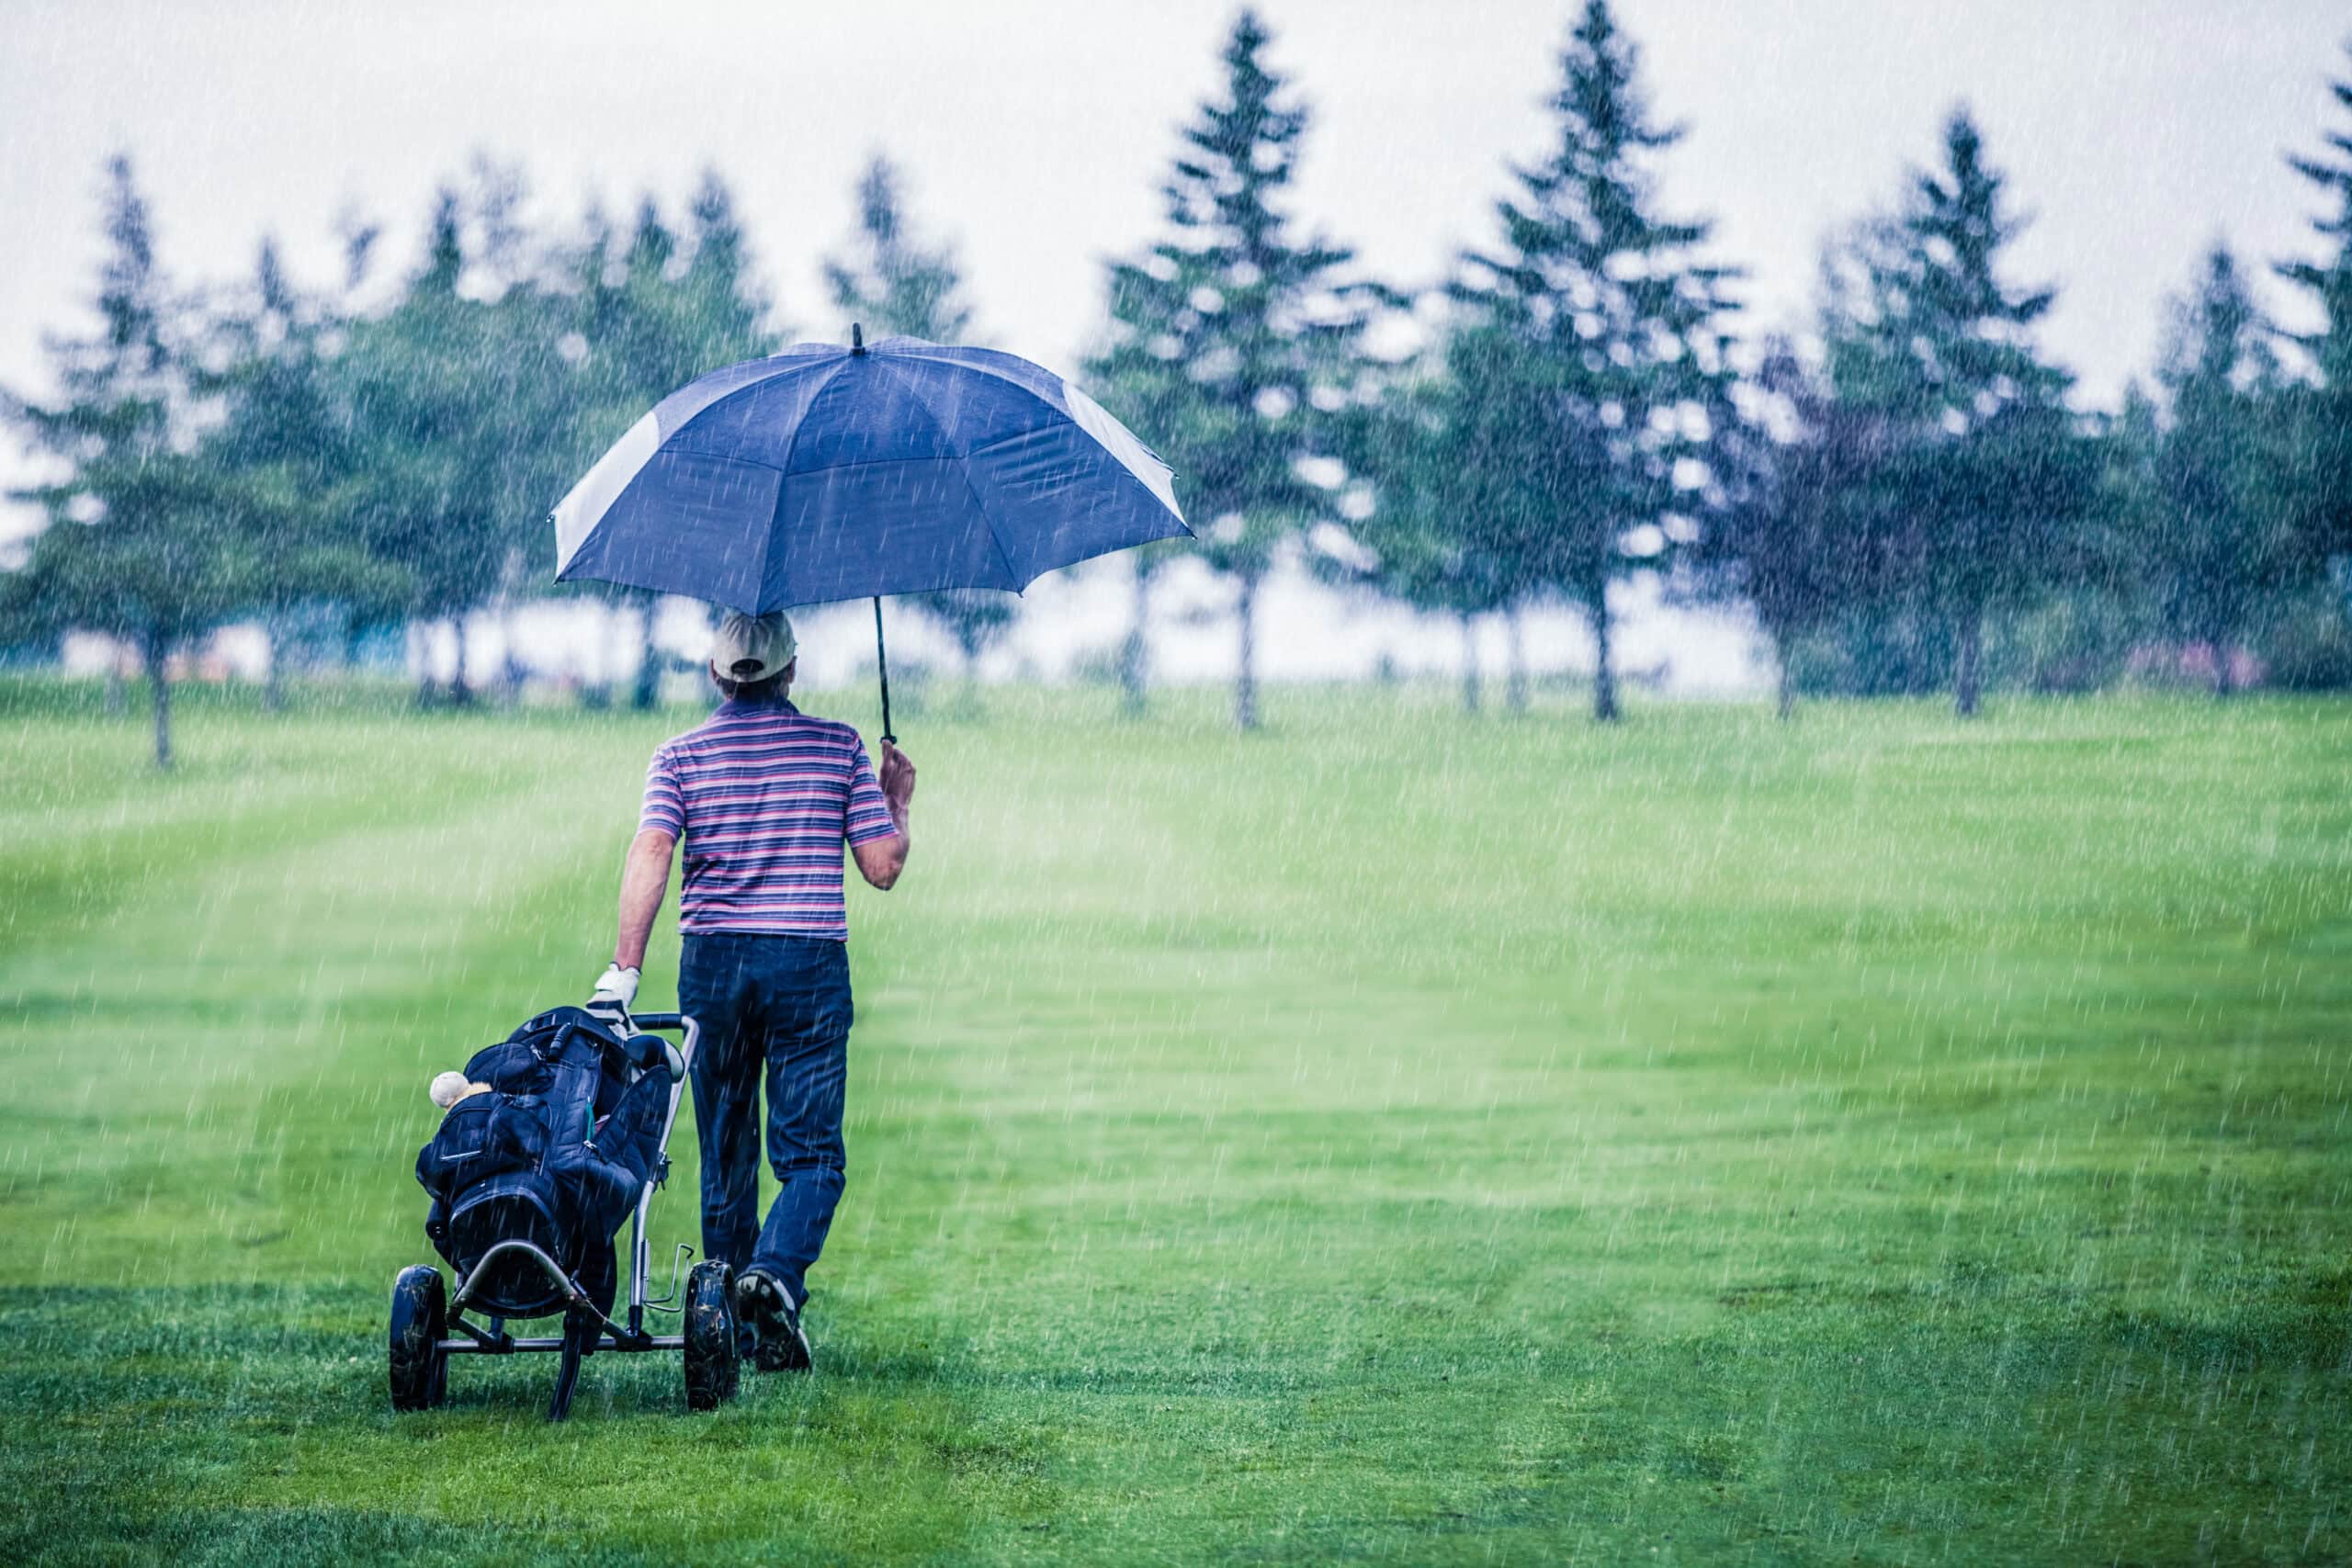
It’s a threat because of not only the damage it can cause, but also due to the amount of time we spend in the agronomic ‘danger zone’ between autumn and spring.
For 2023 we have an extra tool in the turf management arsenal in the TurfAdvisor app.
There are obviously no magic bullets for stopping this disease, but the app can be set up to help you monitor conditions which are more conducive to disease outbreaks.
Monitoring being the essential first step.
Knowing when conditions are conducive to the disease, so the team can be extra vigilant when out on the turf to report back any early disease activity and plans can be set in motion.
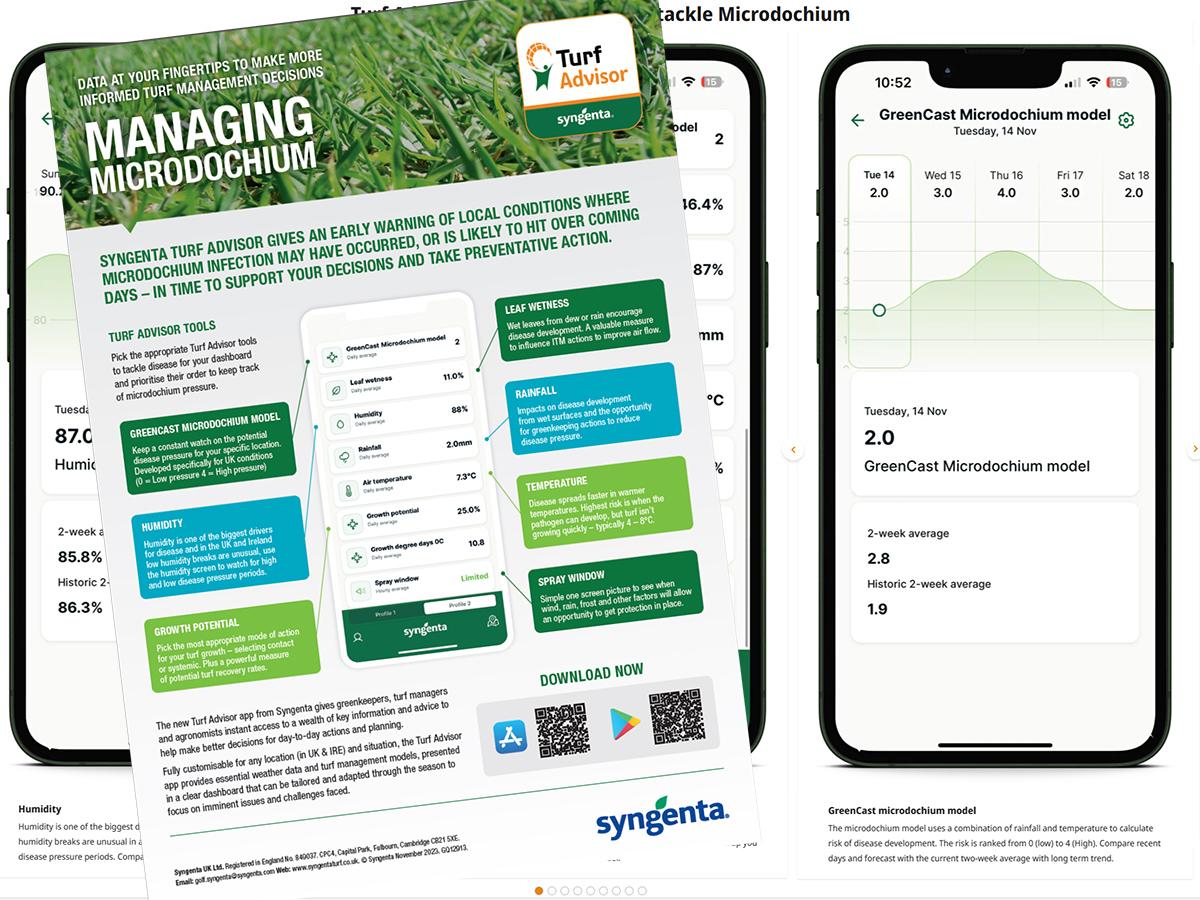
Read more about setting up your TurfAdvisor for managing Microdochium this season here.
Lots of things to be keeping an eye on agronomically for this disease, as with all turf diseases it’s really nothing to do with dates on a calendar and everything to do with the conditions in play.
The Greencast Microdochium model is by no means perfect but can give a useful indication of disease risk.
I’ve agreed with Glenn that we’ll do a short video to run through the long and short of the disease model in the coming weeks.
Greencast Microdochium model intro
- It outputs a score, with 4 highest and 0 lowest.
- It’s the same model that the ‘Historic Disease information‘ on the website is based on.
We are now entering into the period of “4’s” and these could be the most damaging ones of the season… as it can be hard to shake scares taken on this side of Christmas until we see renewed growth in the spring.
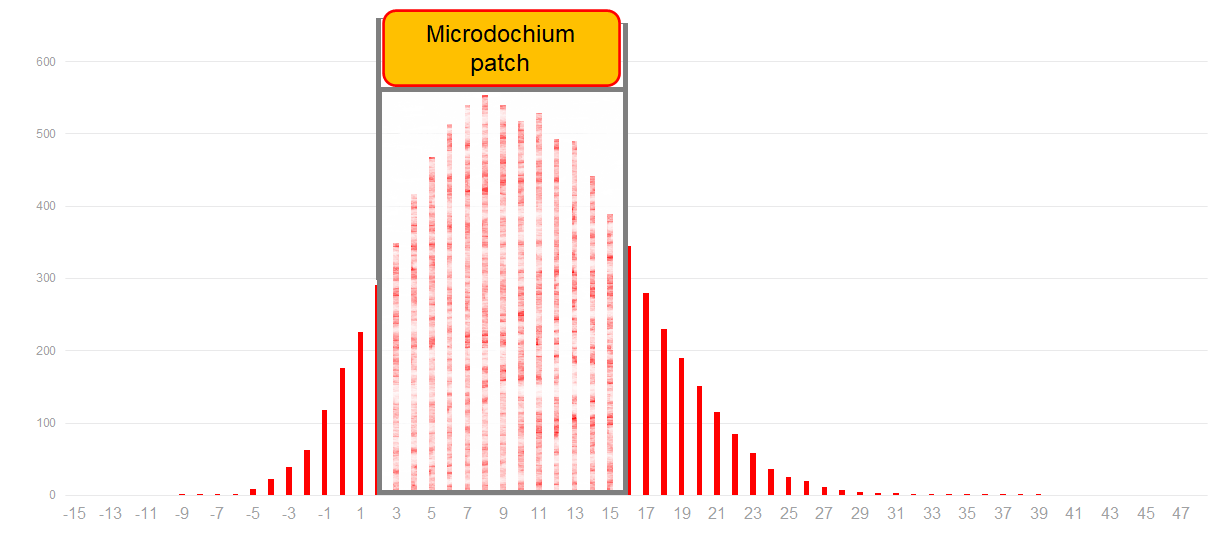
You may remember this graph from earlier in the year, to represent just how much time we spend agronomically in reach of this disease (temperature wise).
Its a huge portion of the year.
(Cumulative days stacked over the average daily temperature)
In its simplest form a score of 4 means you are most likely to see a damaging outbreak of Microdochium patch disease.
Now, why am I not just saying “4 = highest disease pressure“?
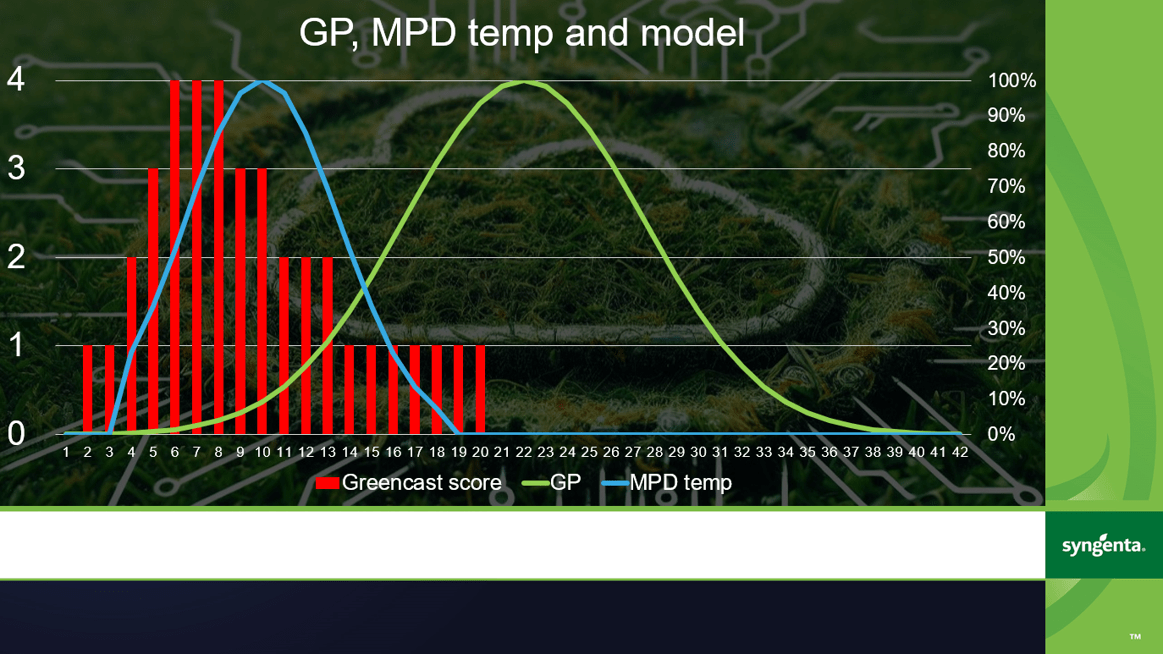
The graph below helps show why….
A lot going on in this one so bear with me!
In blue we have shown where Microdochium will develop best. Optimum temperature for its development is around 10°C. So the question becomes:
Why isn’t the model (red bars) giving it’s highest score at 10°C? The reason is, yes the fungus develops better at 10°C but the potential for lasting damage to turf surfaces is less, as we have grass growth and so recovery.
The green bell curve shows GP (growth potential) the further we get towards the optimum (around 20°C) the better/faster cool season grasses should grow (all things being equal (available moisture, nutrition etc…))
So, whilst the disease would prefer it slightly warmer, its not such a threat to us when its warmer as generally we can:
- outgrow damage so it’s not really an issue, or
- rapidly recover from damage as we have good levels of growth.
The model considers average daily temperatures of 6 – 8°C to be the most risky, as Microdochium can be plodding along, but turf growth, as we can see in the green GP curve is barely moving.
You may sit at 6°C for weeks and see no disease. There is certainly no guarantee you’ll see active disease because the model indicates it’s high risk.
If other agronomic factors are in your favour, or you’ve nailed the cultural practices, or you got down a preventative fungicide recently you’d be unlikely to see a disease flare up.
It’s just an indication that, when scoring a 4, if disease does break out it would be more damaging than at other times due to the climatic conditions.
The model also factors in rainfall, as we know moisture is hugely important for fungal growth.
But rainfall is not the only way we get that disease inspiring leaf wetness, so the model is limited in that way (more on that in the video to come).
When we get to the low temperature end of the graph (left), yes grass growth is not there to support us, but it’s also too cold for disease development.
These are Glenn and Henry’s famous “sub 2°C stopping hours”.
Below 2°C it’s really just too cold for meaningful fungal growth, they are living things too and all biological processes happen slower at cooler temperatures.
Hopefully I’ve managed to highlight some benefits of the Greencast Microdochium model for helping monitor the disease in your situation.
We want to do work to develop it further, but also know that there is no such thing as a perfect model, so ensure you are monitoring the other factors in real time as discussed in the link at the top.
Whether you are monitoring disease pressure to lock down fungicide timings, or additional cultural practices its a good use of time.