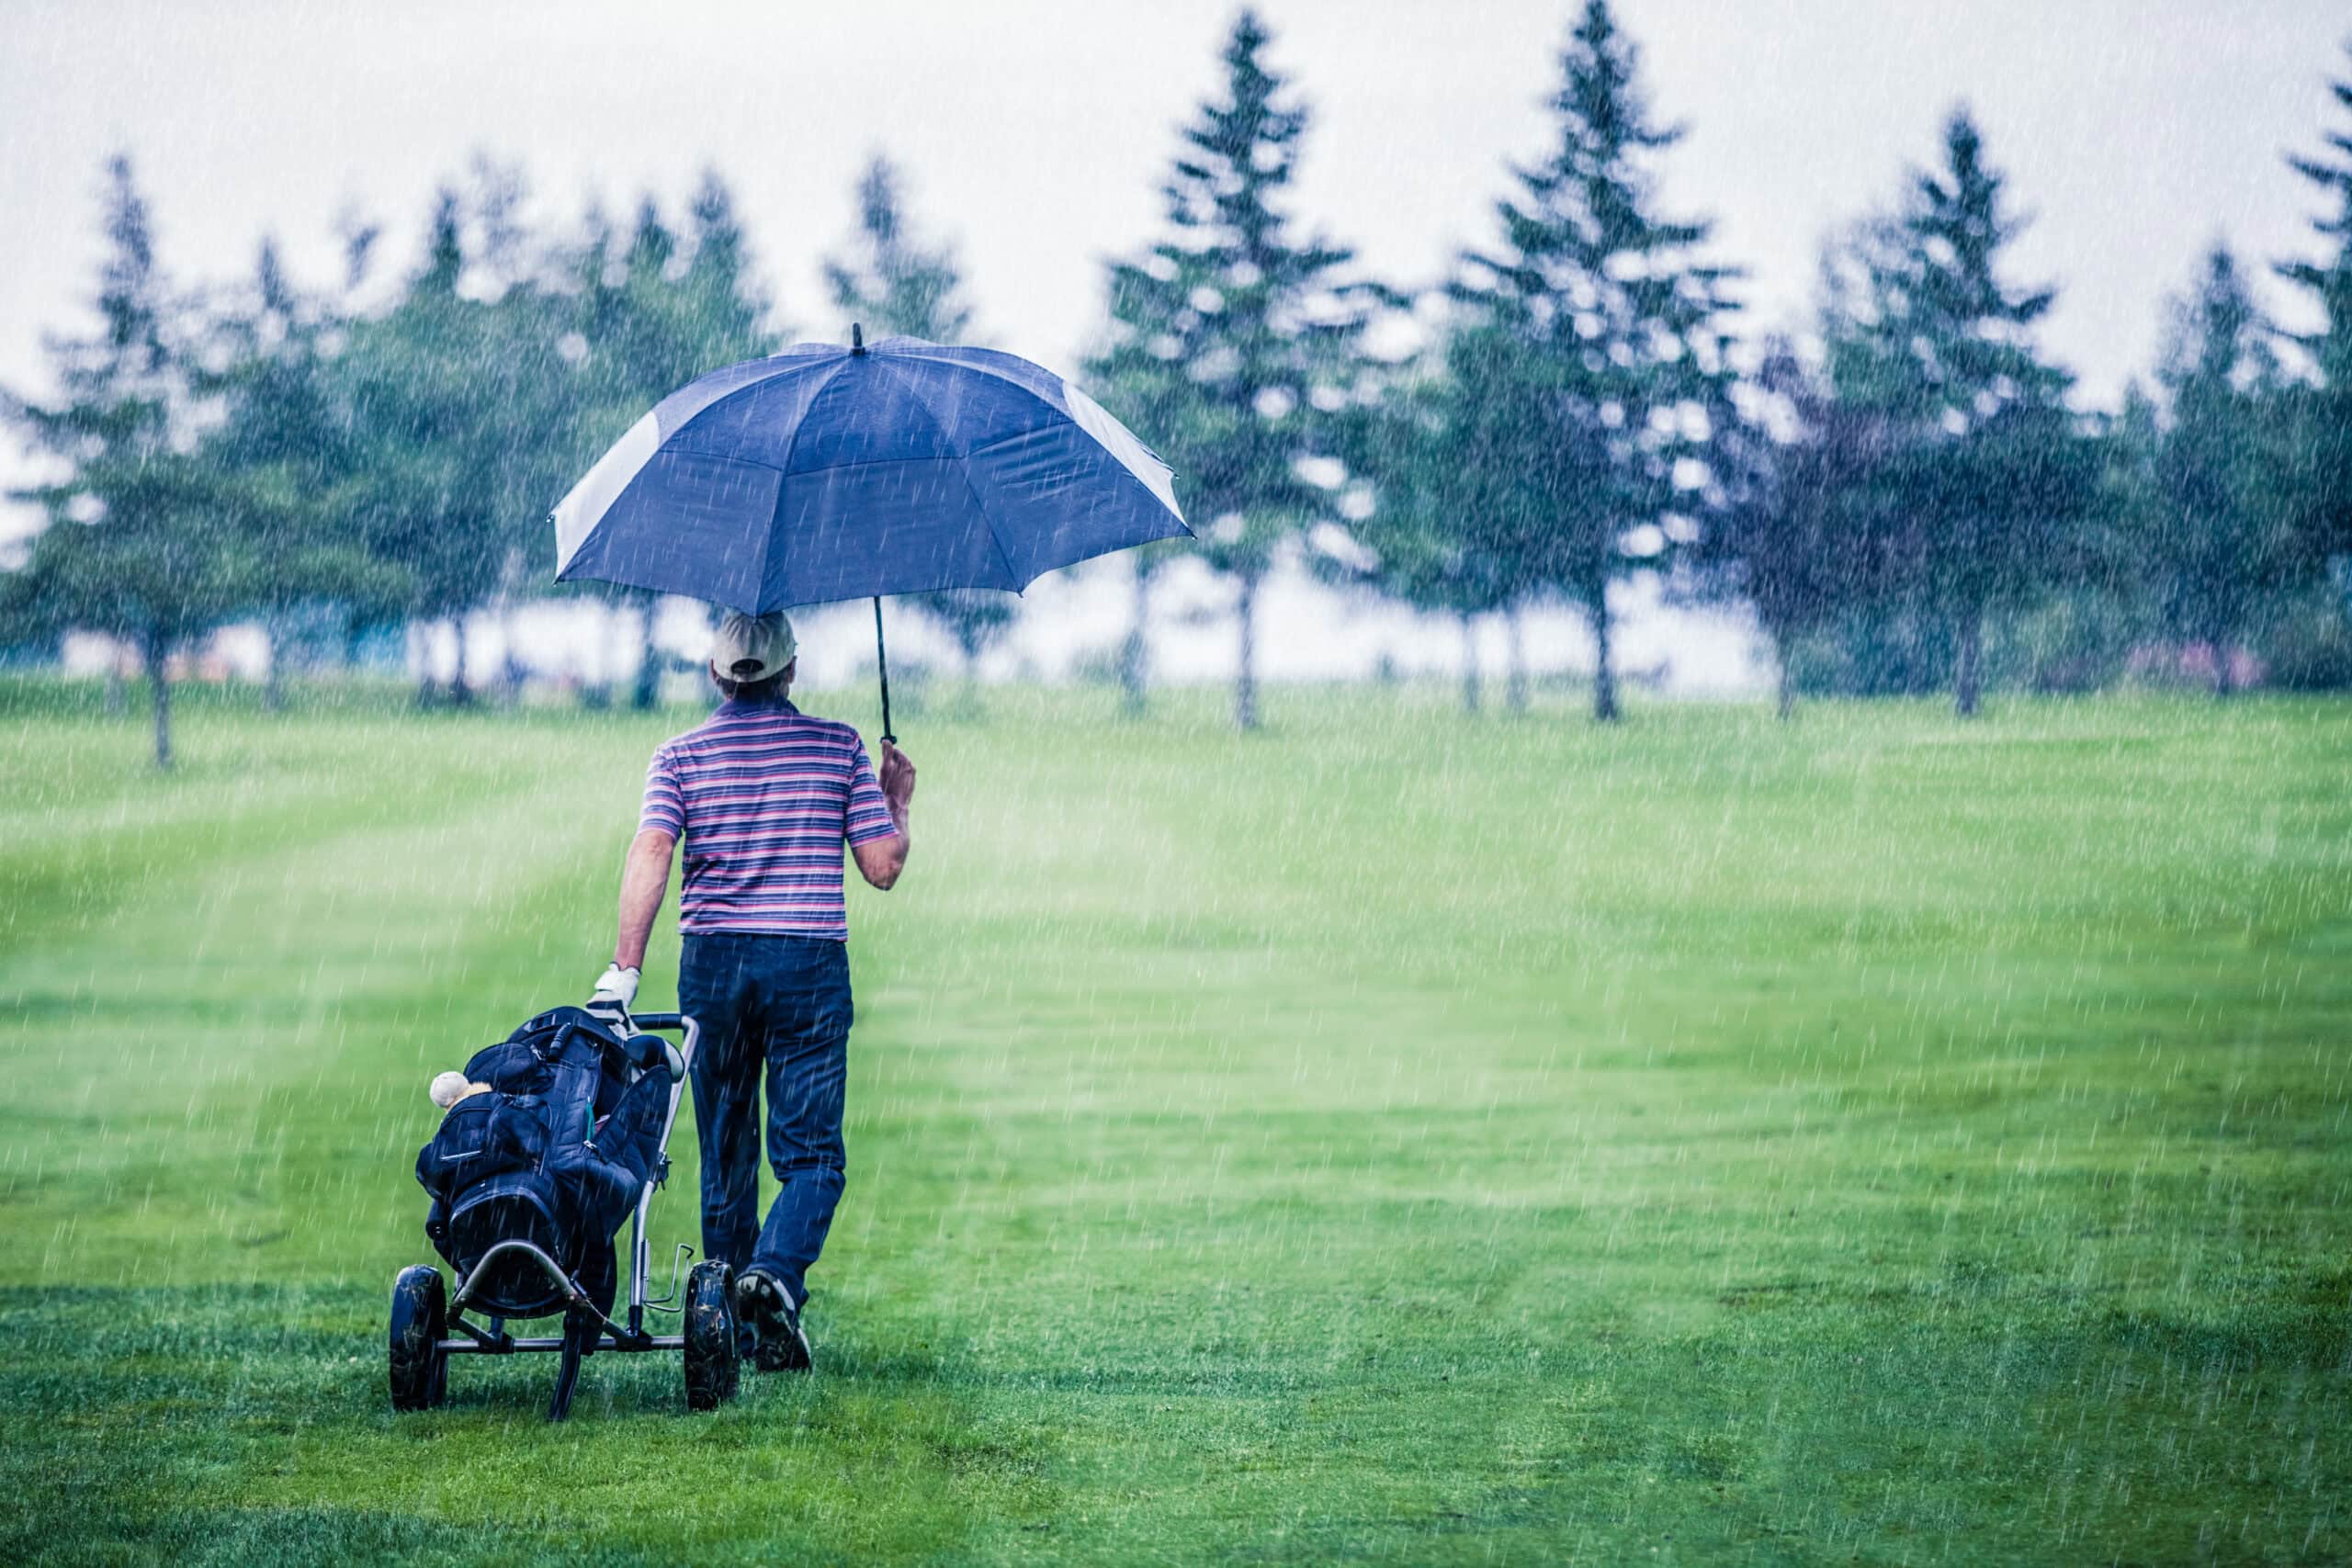
All experienced turf managers know there are some weather conditions that lead to high Microdochium patch pressure.
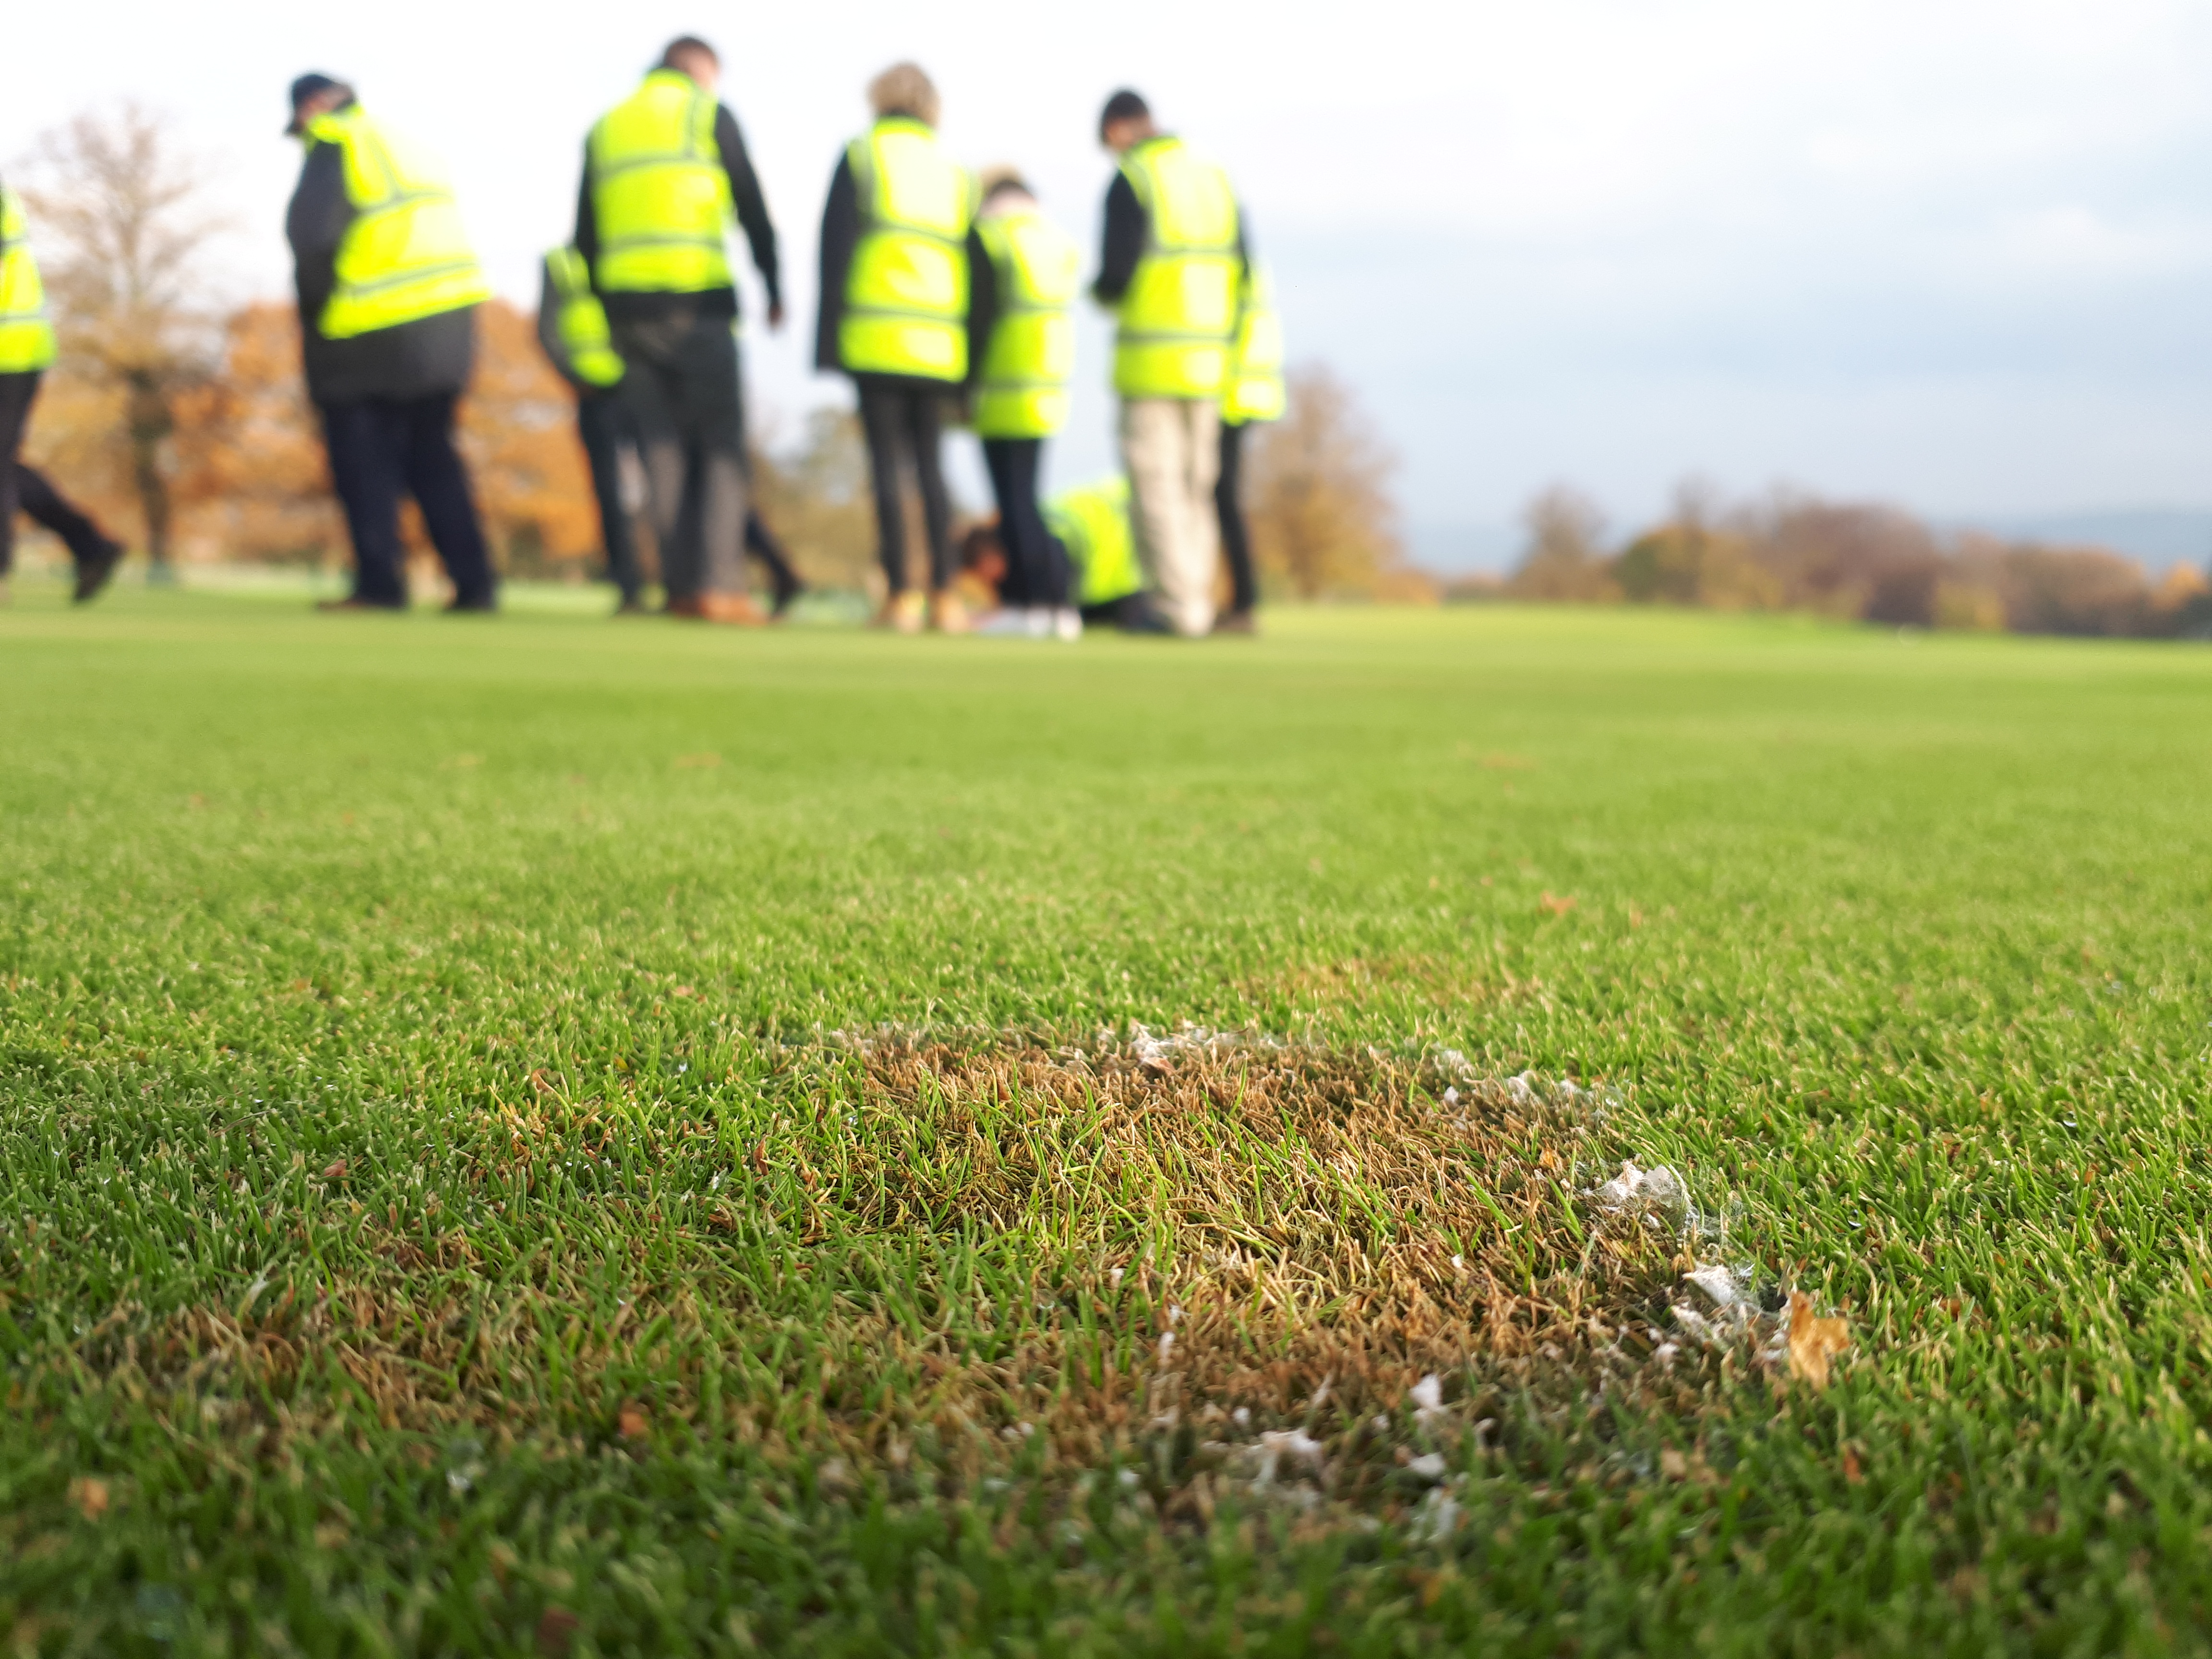
Prolonged periods of leaf wetness and optimum temperatures are exactly those. I wrote an article recently on this concept and how these factors influence the development of Fuz. Read it here…..
By plotting these two factors on a graph we can see just how that looks during high pressure and low pressure periods.
Each dot represents one hour of the day and it shows both the temperature and the % leaf wetness. These aren’t easy stats to find however I have access to Syngenta’s Agricultural data. However for me this begins to justify the expense of a leaf wetness sensor for a weather station.
During this period of the year you can be pretty confident that disease pressure is close by.
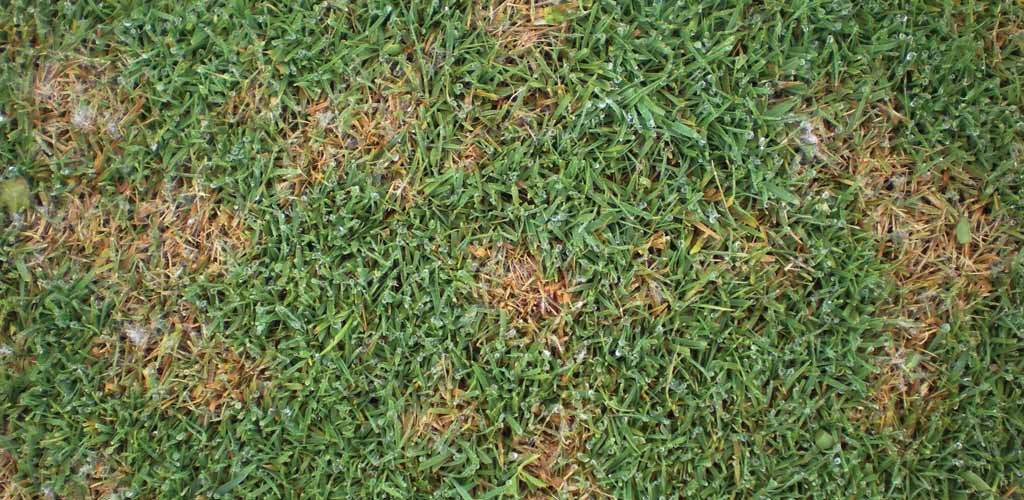
At the end of October this year I was getting a good few calls and seeing social media reflect the same thing that disease pressure was high and people were disappointed with the control they’d achieved.
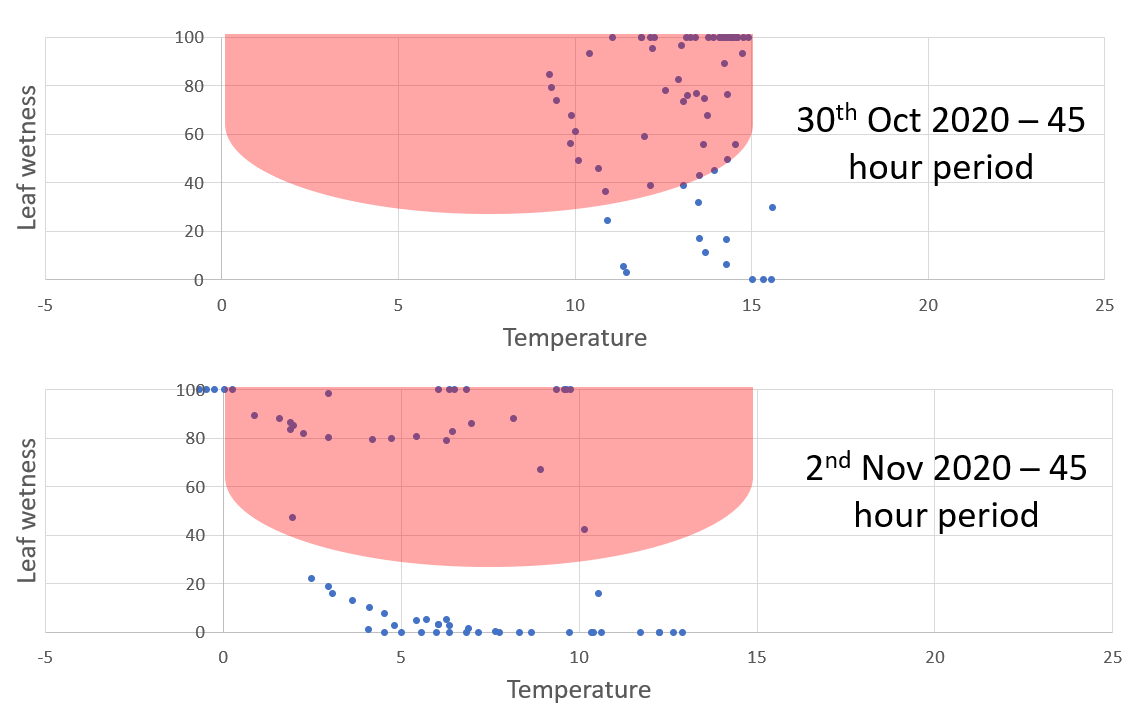
The pressure had subsided only a couple of days later and the calls stopped. For me the more important factor is how many dots are falling outside of the Redzone. Each one of these represents a break in disease pressure, these lifelines are critical during this period of the year.
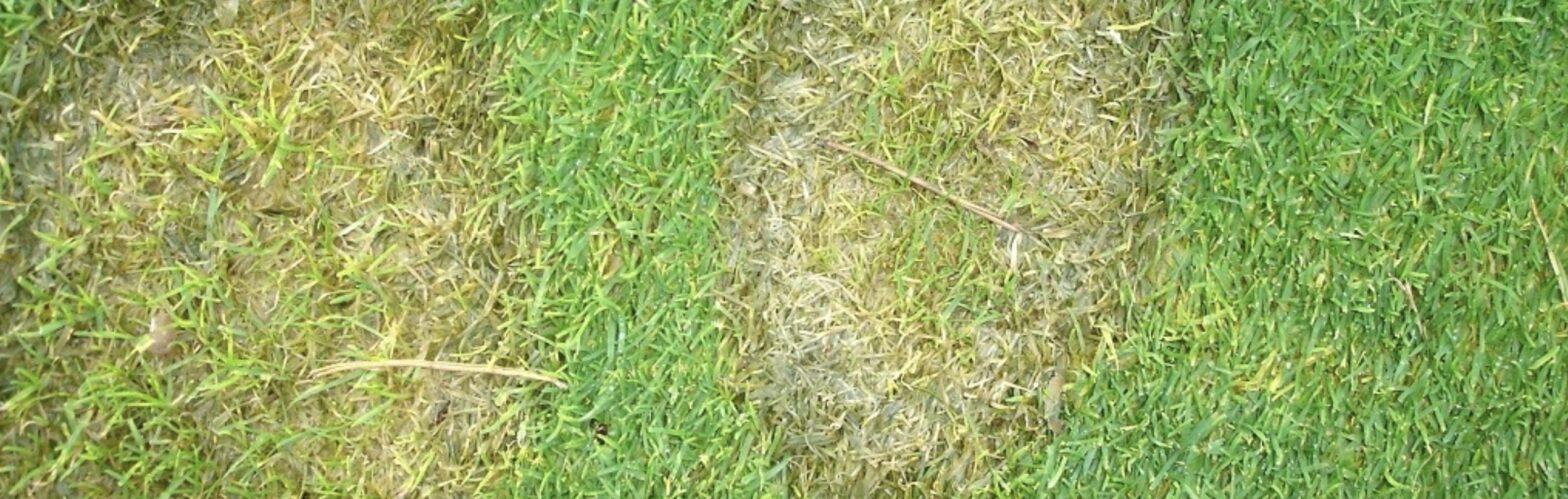
If we don’t get these breaks then even the most robust disease management programme is tested to its limits.
Getting everything right really is critical during these periods
- Good dew management strategies
- Fertility at optimum levels
- Good air flow
- Right timing of Fungicide
- Good application of Fungicide
- Correct fungicide selection
The greencast disease model is based on this concept – although its a pretty old model know with only a basic equation looking at moisture and temperature it’s still a pretty good guide and well worth a look………
This method of plotting disease pressure is something I’m beginning to play with. and has potential to really help us through these tricky periods. The Greencast model has been in place for around a decade now, was well ahead of its time and well worth keeping an eye on.
Mark Hunt of Headland amenity has done more work on this in recent times than anyone does a great job examaining the outcomes of this kind of data in his Blog which is well worth a read if you’ve not seen it already.
The Redzone I’ve created is pretty crude at the moment but it really does highlight the difference between these two 45 hour periods.
How turf disease pressure has grown over the Christmas period in the last couple of years, read my blog here