

Using models to help guide turf management decisions is something everyone does. Many don’t even recognise they are doing it.
Before any fungicide application everyone is, or should be, looking at some of the factors that influence the action they’ll take. In essence, creating their own model.
Formal data gathering isn’t for everyone, but everyone gathers data to make decisions
The better that data is, the better the chance we have of making good decisions. The more we review our methods, the more chance we have of fine tuning them.
That means processing lots of information in your head, including loads of data such as:
The Weather
For most that’s a look at their favourite weather app, for others it’s an expensive weather station, but for some it is as simple how many coats am I wearing today.
Clipping yield
Usually measured by asking Jim, who cut greens today, « how many boxes d’ya take of Jim? ». The answer is usually something like « two boxes Fred, but not much in em », some will make a point of counting the boxes whilst others are measuring daily clipping yield in a measuring jug.
How damp the leaf is?
Anything from noting how much dew there was today, to watching the humidity on your weather app – and some even have nice leaf wetness meters plugged into their expensive weather stations.
How healthy is the plant?
Some will look to fertility records, some will be acutely aware of the amount of foot traffic and others will be using there NDVI meter they have purchased using their Turf Rewards vouchers.
How long since I applied a fungicide?
Some will rely on memory, some will note it on the white board and some will use Growing Degree Days, or Growth Potential, to count down from the last application.
Additional sources of data
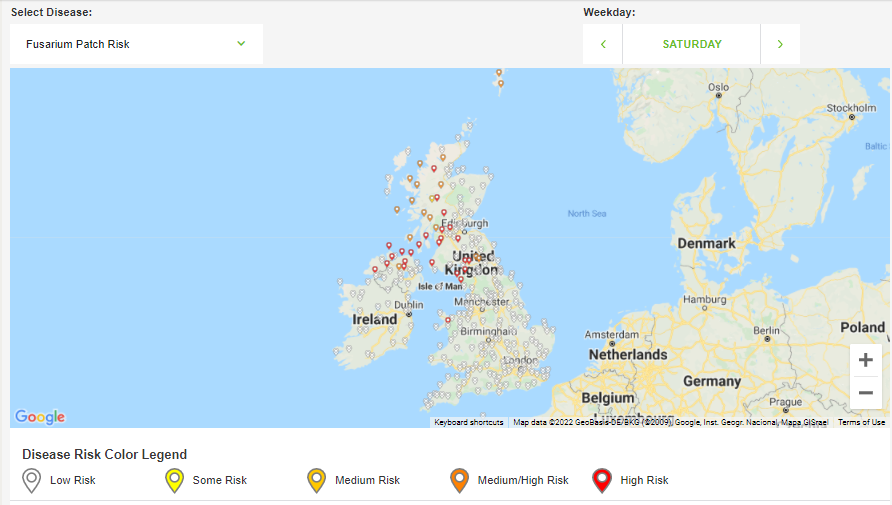
Some ask their local peers, some will scour Twitter and others will reach to things like the Syngenta live disease tool to reinforce their thoughts.
These types of tools are a useful additional piece of information to add into your decision process – if you recognise the fact they are designed as decision support tools, not making the final decision for you.
There are too many variables for them to be super accurate, but they are a useful additional tool to help.
Digital models, such as the Syngenta Turf website Disease Risk Index, or Live Disease Map with five-day forecasts, are simple tools that rely on weather metrics to indicate the pressure. It is good within the parameters of weather alone, but it doesn’t have access to all the other influences highlighted earlier.
It can’t compete with the complexities that you process in your head, but it does have an advantage – it has a good and consistent memory.
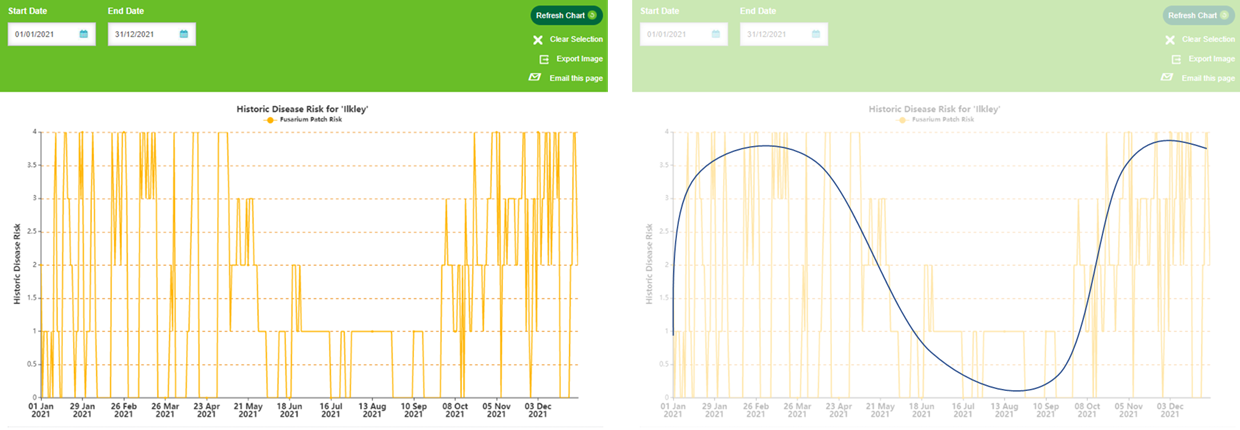
One of its major advantages is to be able to look back and ask what happened when a certain set of weather conditions or weather patterns occurred, and how did that affect your turf? All those seasons of accumulated data are available in the Syngenta Turf historic disease model.
Whilst we are in a generally less busy period of the year, can I suggest you take a look and review your year and your site.
When looking at these graphs, recognise what it can do – it can accurately pick out periods of optimum temperature for diseases to thrive, but it can’t accurately pick out how vulnerable and how wet the leaf sits on your site.
A good method is to look at a year-long period and pick out the peaks and troughs in there for the challenges you have. Then look over successive years and see any patterns that appear.
Rather than looking for high resolution for accurate disease prediction right at the last minute, use them to highlight when you’re in a period that is optimum for the disease to thrive. What you’ll soon realise when you do this is just how long a period of the year your surfaces are under high pressure and what a good job you do of keeping it at bay.
Rather than looking for granular detail – use the historic charts to identify your pressure periods.
As we move towards a time of greater weather extremes and variability, the lessons of what we have seen in the past become even more important to help make more appropriate decisions in the future.
