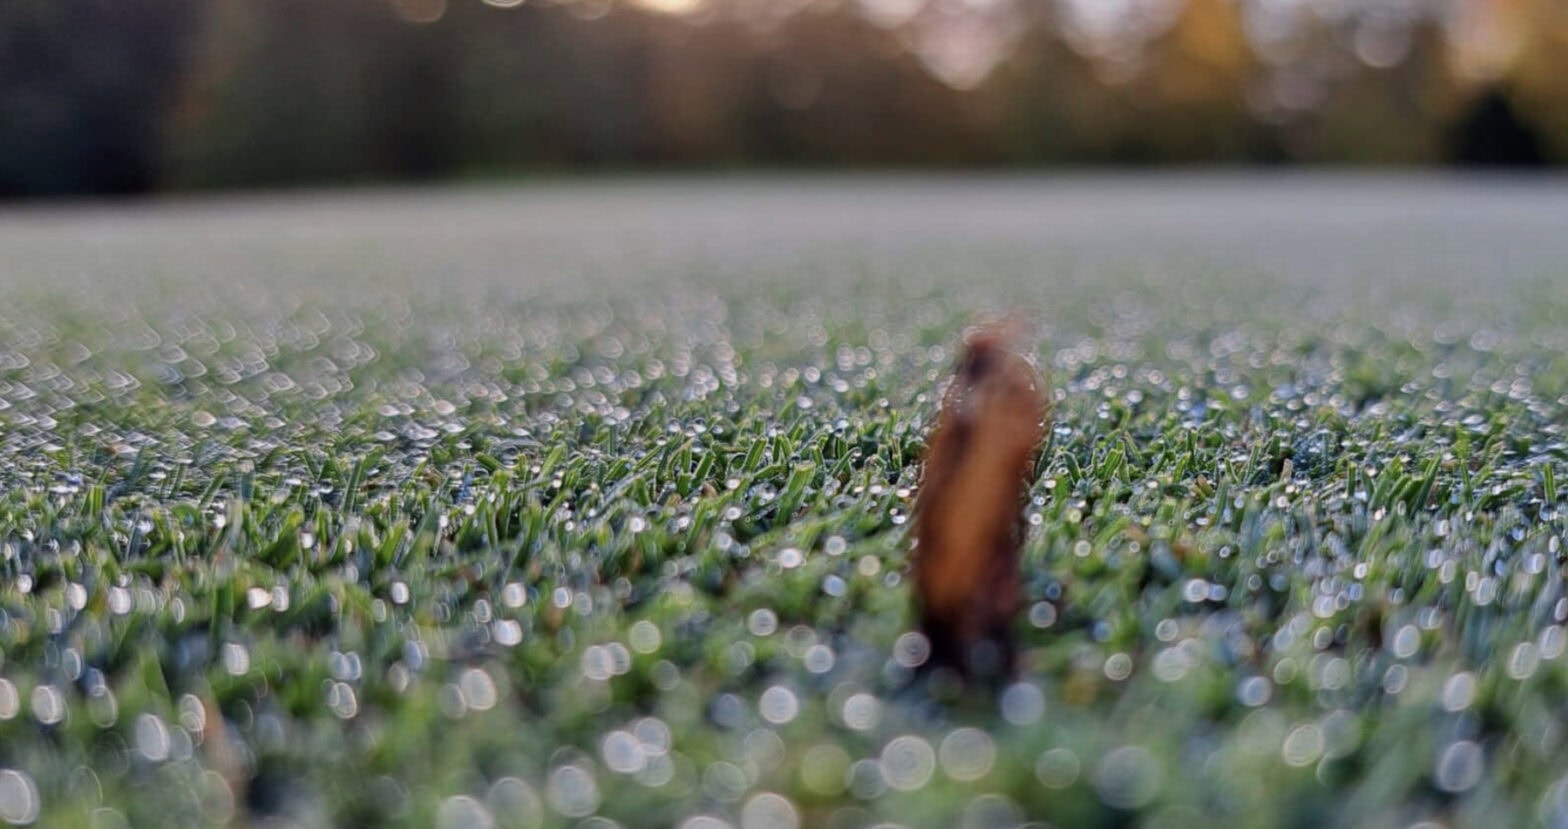
Does anything say early October more than a leatherjacket cast skin popping through the morning dew?
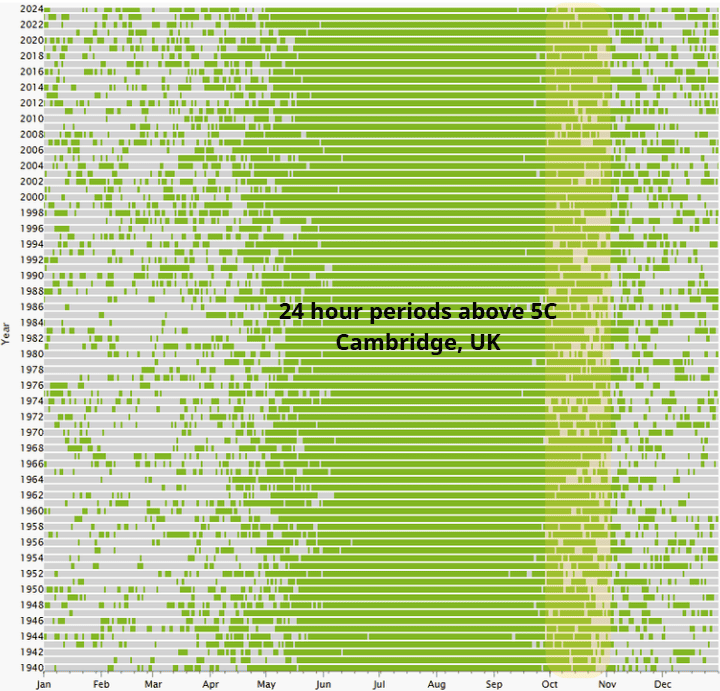
Looking at the environmental data (1940 -2024), October is the last month of good growing weather for many.
In Cambridge where I’m based you can see how we lose those consistent temperatures above 5ºC rapidly, the ones that offer growth opportunity and disease scar recovery.
I’m watching the Microdochium season with even more intensity than normal this season as I’m involved in a Global initiative from Syngenta to improve the disease models we use to help manage turf.
Read my Microdochium Madness blog here.
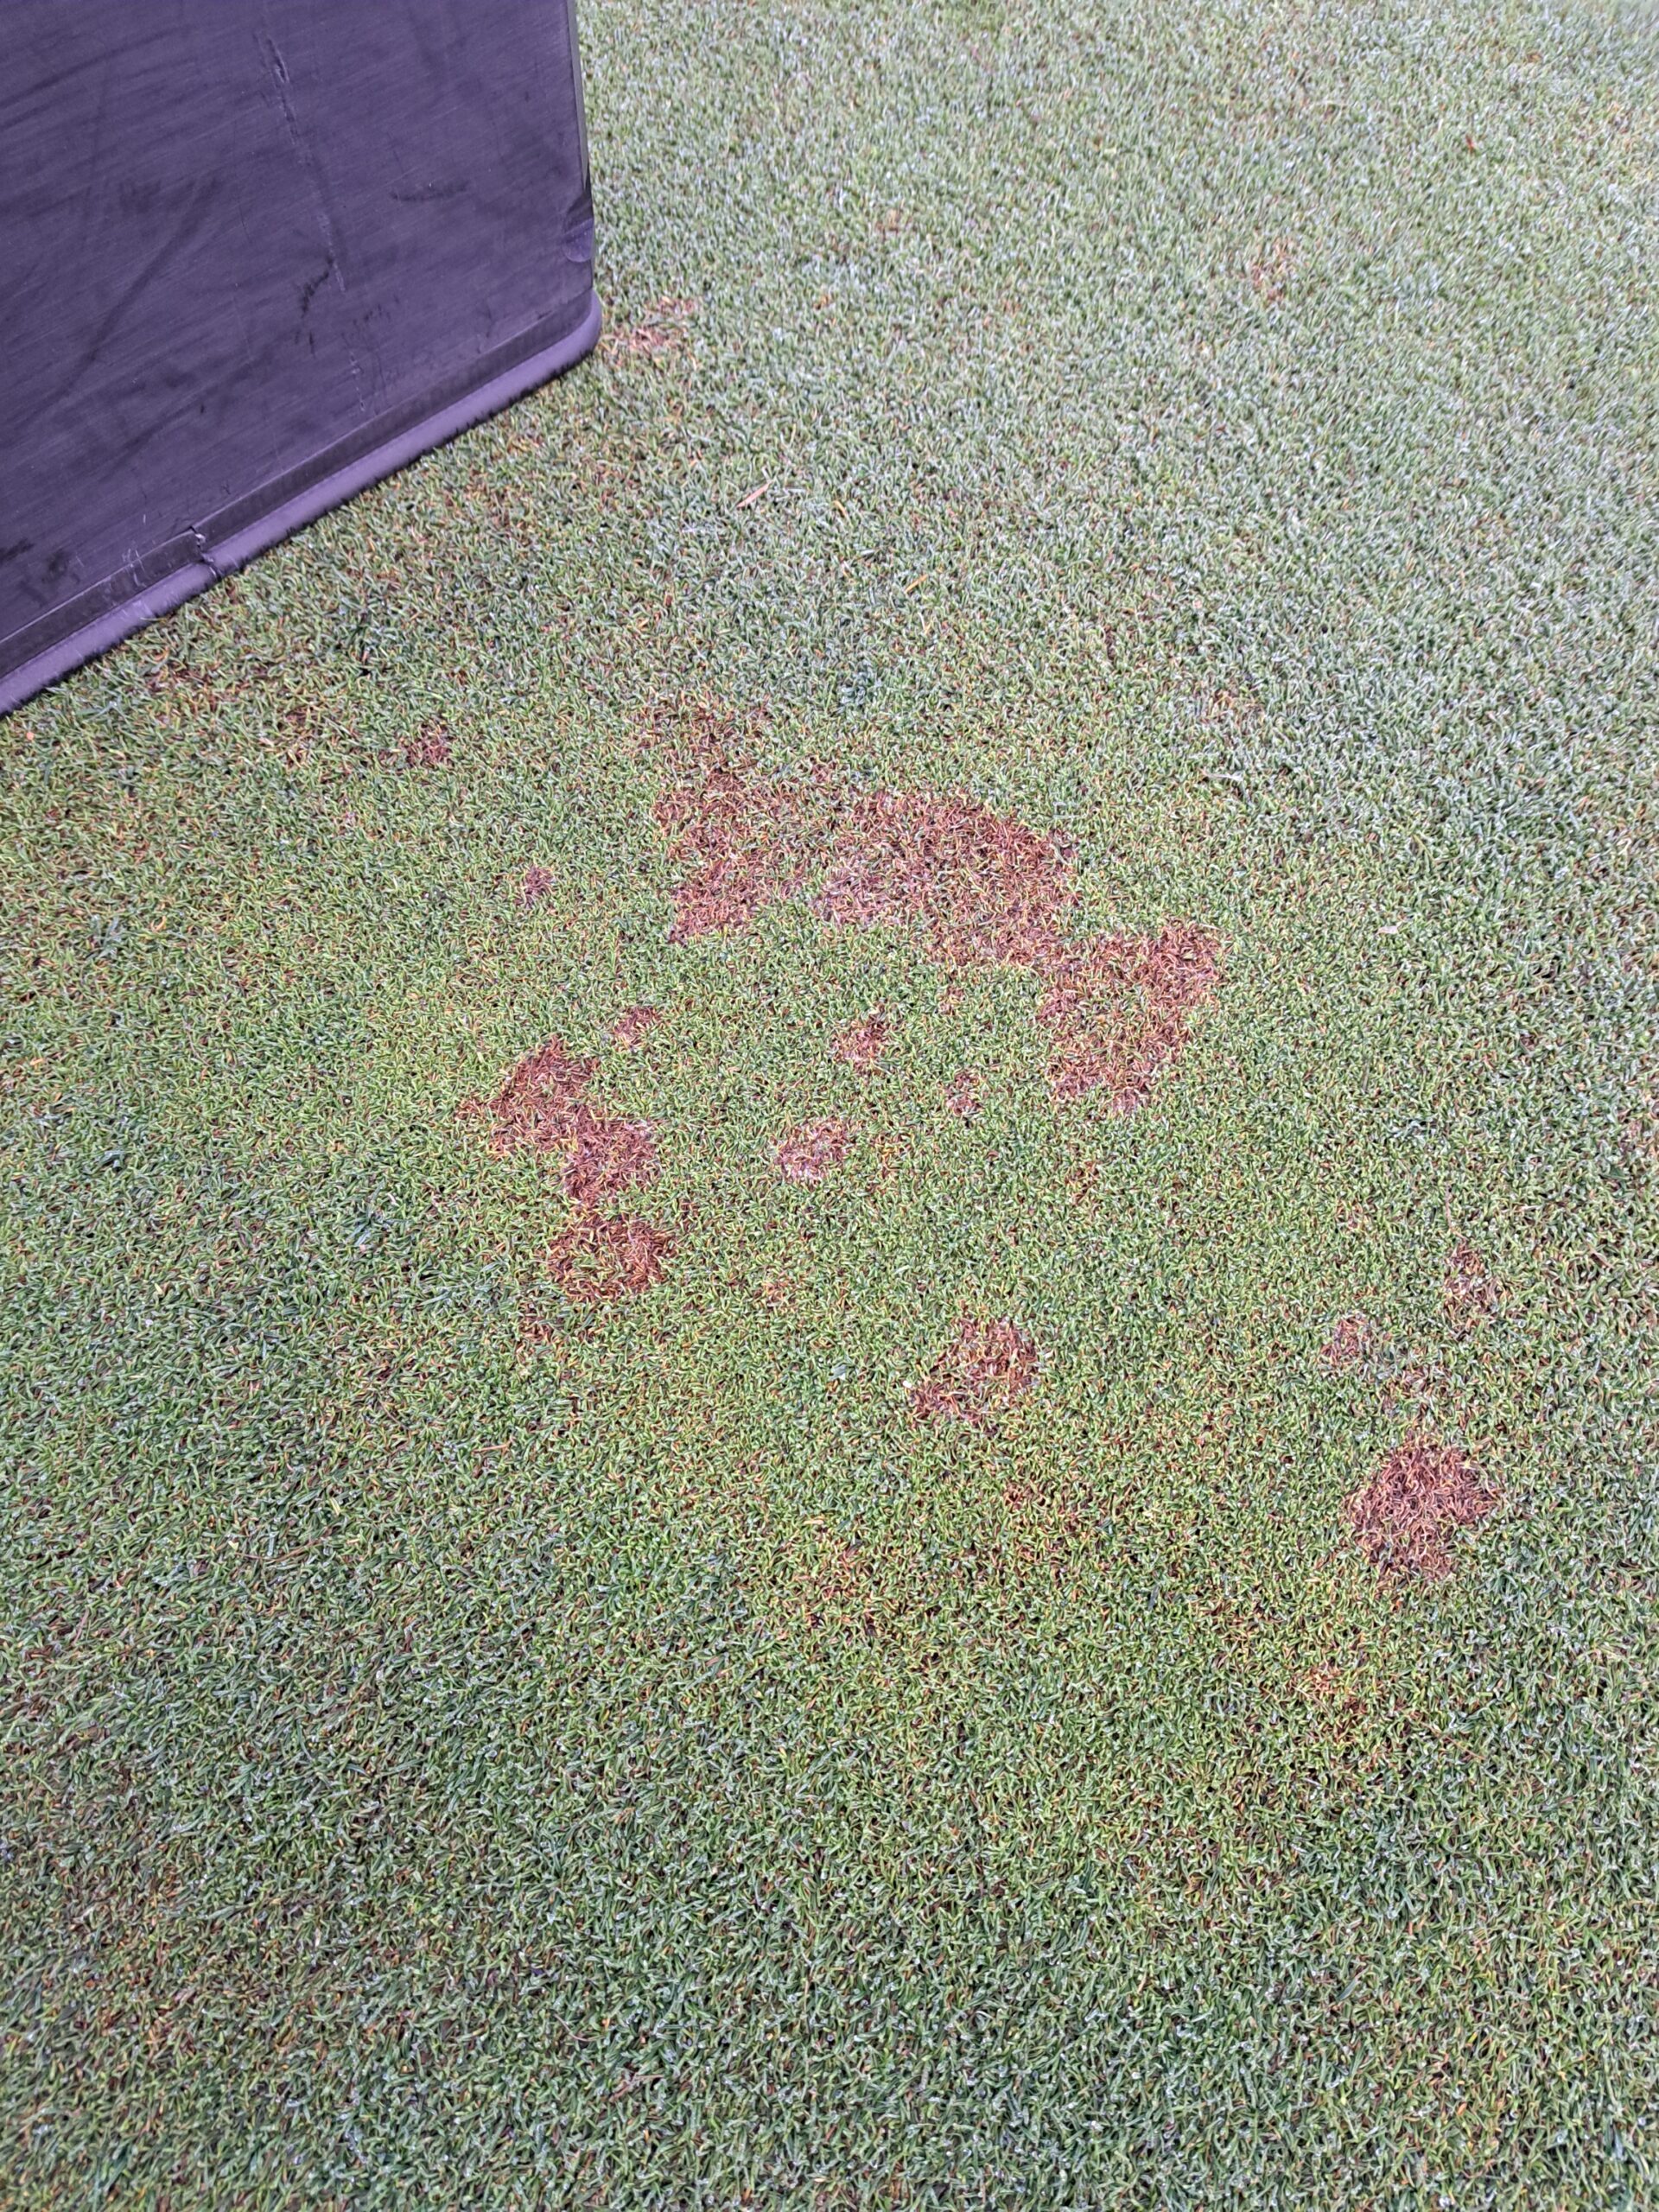
We have a well researched model (Greencast Microdochium model) in TurfAdvisor, it does a good job of tracking the temperatures that Microdochium disease thrives at, but it’s weakness is the moisture element of the equation.
It needs 3 rain events in 6 days to register a warning.
Last Autumn we had a stretched period of heavy mist and fog and low air movement, which led to no warning in the model but a lot of disease on surfaces.
The project this year has grand aspirations « to build the worlds best Microdochium model » or at least that’s how I see the goal.
And it’s being powered, much like the PestTracker project (the crane fly peak flight) was, by those of you on the course every day!
My role was simple – fill a WhatsApp group with people passionate about finding a fix for the UK & Irelands biggest turf disease.
We’ve got 78 in the group, thanks so much to those who are involved!
If you want to join up send me a email. moc.atnegnys@sekaol.naes
Every other day a simple poll is dropped into the chat by my colleague Henry in the US, who is doing all the statistical heavy lifting on the project.
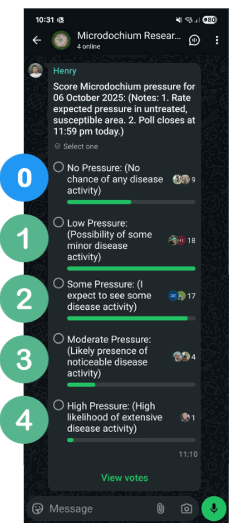
With some wizardry on his end that data is then fed to the computer system to figure out what’s going on weather wise at each location.
We are certainly not finished yet, but it’s already offering some interesting insights.
Participants answer based on expected pressure in an untreated area; so if you made no fungicide treatment in an area do you think you would be seeing disease occurring today?
So if all the group reported high pressure we’d see the graph ramp up to a 4 below.
The reality is with models that there are many factors which have an impact and we’d be very unlikely to see a 4 on the graph as not all sites see pressure at the same time across the full geographical range.
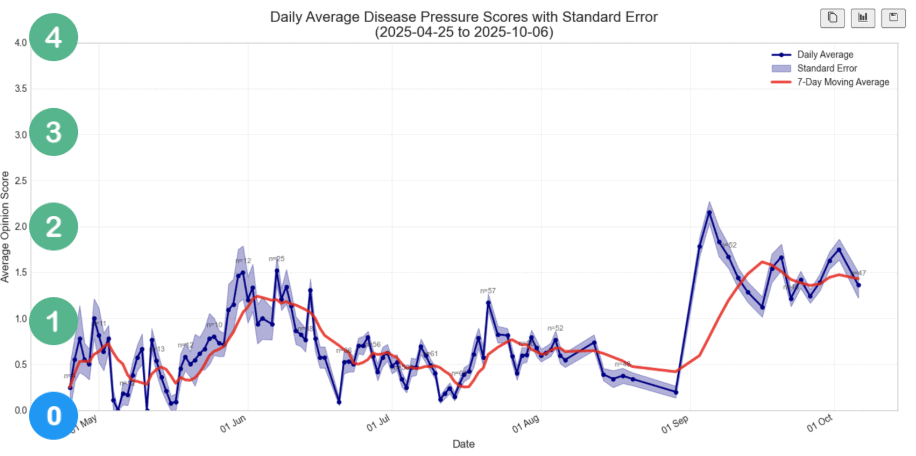
So far the data is informing us about trends, but once overlayed with site specific weather data we should be able to build something game changing, I look forward to being able to say more!
Don’t forget to make any planning for leatherjacket controls later this month if you have been seeing activity.
October 20th Is the guide Acelepryn application date, with NemaTrident F to follow within 7 days for those in the LTAP club.
(LTAP and Nematrident window is now closed, watch out for the info for summer 2026 if you missed it).

