

Before getting into the numbers, I want to explain why I’m using three data sets rather than one, because this gets to the heart of how wetting agents are often misrepresented in trials.
The problem with single-metric trials
Most premium wetting agents make broadly similar claims – better penetration, improved water retention and reduced hydrophobicity – those claims can be hard to separate. That’s why the way trial data is collected and presented matters for your decision making.
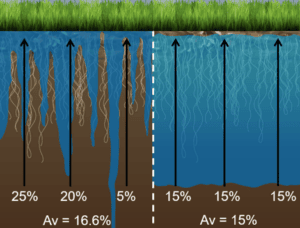
The most common approach is to report an average VWC (volumetric water content) reading across a plot or to a set depth. The problem is that averages hide what actually matters: uniformity across the area, and where in the profile the moisture is being held. A plot averaging 16.6% VWC, for example, can still contain patches of very dry turf, while a consistent 15% may deliver better real-world performance.
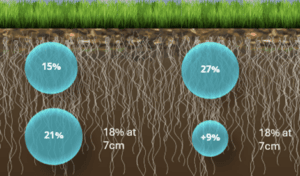
Depth matters too – holding water near the surface is undesirable but if we take an average moisture reading over a set depth this masks where the water is being held in the profile.
To avoid that ambiguity, I’m combining three complementary data sets:
- Average VWC – the headline number, but only part of the picture
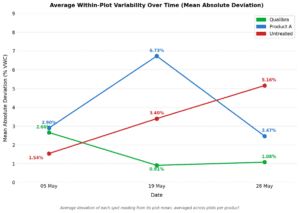
- Within-plot variability – how far individual readings deviate from the plot average, which tells you about uniformity
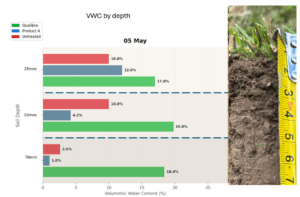
- VWC by depth – using a moisture probe for horizontal probing of the profile to show where water is actually being held
Together these give a much more complete picture of how a product is performing, particularly during and after heavy rain, when you can see how water is moving through the profile.
May results – fairway trial
On fairways I’ve been comparing two products – Qualibra and another commercial wetting agent making similar claims. Both are applied at 50% of their typical rates of use on greens, which many would consider is more practical for fairway treatments.
The trial set up is simple:
On Remedy Oak GC near my home so I can pop in and collect data every few weeks..
- 1 area remains untreated
- 1 is treated with Qualibra 10L/ha monthly
- Final area is treated with another wetter product at recommended fairway rate
- Readings taken with a WET150 TDR
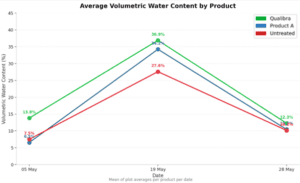
Looking at average VWC(bellow), Qualibra applied at 10 l/ha on the fairway is performing very well. But it’s when you move beyond that headline figure that the differences really start to show.
The within-plot variability data (graph bellow) shows a noticeably lower spread of readings on the Qualibra-treated fairway – moisture is being held more evenly across the whole area, not just lifting the average. That consistency is, a more meaningful measure of product performance than the average figure alone. This graph shows on average how much each reading deviates from the average moisture reading for each fairway.
The depth profile adds further weight to this. The two products are behaving quite differently in terms of where moisture is being retained through the profile, and those differences have practical implications depending on your surface and rootzone characteristics.
I’ll be building on this data through the summer. Conditions permitting, the next heavy rain events should give us more to work with on the penetration side – but based on what May is showing, Qualibra is producing results that are hard to ignore.
